Fertilisers Prices: Annual ($/tonne)
(Data Source: World Bank Commodity Markets section)
This section captures annual trend in prices of various fertilisers. In the Table:
DAP (diammonium phosphate) price is the spot, f.o.b. US Gulf price
Phosphate rock price is f.o.b. North Africa price
Potassium chloride (muriate of potash) price is Brazil CFR granular spot price from January 2020; previously, it was f.o.b. Vancouver price
TSP (triple superphosphate) price is spot, import US Gulf price
Urea, (Ukraine) price is prill spot f.o.b. Middle East, beginning March 2022; previously, it was f.o.b. Black Sea price
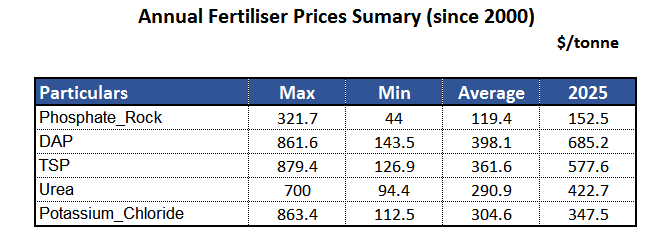
During 2025, the average price of Phosphate Rock was $152.5/tonne, DAP was $685.2/tonne, TSP was $577.6/tonne, Urea was $422.7/tonne and Potassium Chloride was $347.5/tonne
India is a large importer of fertilisers and fertilizer raw materials and is a major price influencer in the global market for fertilizers like urea and DAP.
India imports 100% of its Potash (MOP) requirement and 50-60% of it's DAP requirement (either finished product or raw materials). While domestic Urea production meets most of the country's needs, imports are still sizeable to influence global prices
| Year | Phosphate Rock dollar per ton | DAP dollar per ton | TSP dollar per ton | Urea dollar per ton | Potassium Chloride dollar per ton |
|---|---|---|---|---|---|
| 2025 | 152.5 | 685.2 | 577.6 | 422.7 | 347.5 |
| 2024 | 152.5 | 563.7 | 474.6 | 338.3 | 295.1 |
| 2023 | 321.7 | 550.0 | 480.2 | 358.0 | 383.2 |
| 2022 | 266.2 | 772.2 | 716.1 | 700.0 | 863.4 |
| 2021 | 123.2 | 601.0 | 538.2 | 483.2 | 542.8 |
| 2020 | 76.1 | 312.4 | 265.0 | 229.1 | 241.1 |
| 2019 | 88.0 | 306.4 | 294.5 | 245.3 | 255.5 |
| 2018 | 87.9 | 393.4 | 346.7 | 249.4 | 215.5 |
| 2017 | 89.7 | 323.0 | 283.2 | 213.9 | 218.2 |
| 2016 | 110.5 | 315.8 | 290.3 | 194.1 | 260.3 |
| 2015 | 120.3 | 416.6 | 377.6 | 277.9 | 296.1 |
| 2014 | 110.5 | 429.6 | 382.0 | 308.4 | 296.6 |
| 2013 | 126.3 | 411.0 | 380.8 | 339.6 | 395.0 |
| 2012 | 184.9 | 480.2 | 462.0 | 398.6 | 465.4 |
| 2011 | 163.6 | 516.3 | 538.3 | 398.9 | 392.8 |
| 2010 | 105.3 | 456.4 | 381.9 | 288.9 | 332.1 |
| 2009 | 222.8 | 288.5 | 257.4 | 251.1 | 558.5 |
| 2008 | 242.7 | 861.6 | 879.4 | 515.0 | 456.0 |
| 2007 | 52.0 | 392.0 | 339.1 | 307.1 | 195.4 |
| 2006 | 44.0 | 229.9 | 201.6 | 222.1 | 178.3 |
| 2005 | 44.0 | 226.8 | 201.5 | 217.4 | 155.0 |
| 2004 | 44.0 | 204.7 | 186.3 | 174.9 | 125.6 |
| 2003 | 44.0 | 171.7 | 149.3 | 138.2 | 112.5 |
| 2002 | 44.0 | 152.2 | 133.1 | 94.4 | 112.5 |
| 2001 | 44.0 | 143.5 | 126.9 | 96.5 | 112.5 |
| 2000 | 44.0 | 147.7 | 137.7 | 100.9 | 112.5 |
| 1999 | 42.8 | 171.1 | 154.5 | 65.9 | 112.5 |
| 1998 | 32.5 | 186.9 | 173.0 | 83.2 | 112.5 |
| 1997 | 32.5 | 187.0 | 171.9 | 117.5 | 112.5 |
| 1996 | 33.0 | 198.1 | 175.8 | 153.7 | 112.5 |
| 1995 | 32.7 | 199.8 | 149.6 | 126.9 | 112.5 |
| 1994 | 31.8 | 160.4 | 132.1 | 93.9 | 112.5 |
| 1993 | 31.5 | 122.0 | 111.9 | 85.5 | 112.5 |
| 1992 | 31.5 | 137.9 | 120.7 | 117.6 | 111.8 |
| 1991 | 31.5 | 158.3 | 133.1 | 138.4 | 106.4 |
| 1990 | 31.3 | 154.7 | 131.8 | 115.6 | 94.6 |
| 1989 | 31.0 | 155.3 | 144.0 | 103.0 | 98.3 |
| 1988 | 31.6 | 180.2 | 158.4 | 113.5 | 86.8 |
| 1987 | 34.1 | 160.0 | 138.0 | 82.5 | 67.3 |
| 1986 | 36.0 | 138.2 | 121.2 | 70.8 | 73.0 |
| 1985 | 36.0 | 157.2 | 121.4 | 111.6 | 83.2 |
| 1984 | 33.1 | 175.6 | 131.3 | 150.2 | 84.1 |
| 1983 | 39.8 | 169.1 | 134.7 | 114.5 | 74.4 |
| 1982 | 43.0 | 166.6 | 138.4 | 124.0 | 83.3 |
| 1981 | 49.0 | 177.6 | 161.3 | 182.5 | 110.2 |
| 1980 | 44.7 | 222.2 | 180.3 | 200.6 | 106.5 |
| 1979 | 35.5 | 193.3 | 146.2 | 153.0 | 76.5 |
| 1978 | 31.3 | 139.8 | 98.0 | 136.0 | 59.0 |
| 1977 | 61.8 | 134.1 | 97.9 | 120.8 | 55.3 |
| 1976 | 35.8 | 119.9 | 90.9 | 82.0 | 55.5 |
| 1975 | 67.2 | 242.5 | 202.5 | 168.0 | 81.3 |
| 1974 | 54.5 | 332.6 | 303.6 | 285.8 | 60.5 |
| 1973 | 13.8 | 118.8 | 99.5 | 64.8 | 42.5 |
| 1972 | 11.5 | 91.0 | 67.5 | 29.3 | 33.5 |
| 1971 | 11.3 | 61.8 | 43.3 | 16.0 | 32.5 |
| 1970 | 11.0 | 54.0 | 42.5 | 18.3 | 31.5 |
| 1969 | 11.3 | 58.0 | 39.3 | 26.6 | 22.0 |
| 1968 | 11.5 | 60.5 | 37.5 | 35.5 | 24.0 |
| 1967 | 12.0 | 68.5 | 45.0 | 49.3 | 25.5 |
| 1966 | 13.0 | 50.0 | 59.3 | 27.5 | |
| 1965 | 14.0 | 54.0 | 65.8 | 29.5 | |
| 1964 | 12.5 | 53.0 | 60.5 | 32.5 | |
| 1963 | 11.5 | 52.0 | 42.3 | 30.0 | |
| 1962 | 11.5 | 51.0 | 42.3 | 30.0 | |
| 1961 | 13.0 | 52.0 | 42.3 | 30.0 | |
| 1960 | 13.0 | 53.0 | 42.3 | 28.5 |
Fertiliser Prices Summary
Table below captures Maximum / Minimun / Average of prices of various fertilisers since 2000, along with the latest prices