Natural Gas Prices Annual ($/MMBTU)
(Data Source: World Bank Commodity Markets section)
This section captures trend in annual Natural Gas prices in US, Europe and in LNG Japan price, as also inter-market deltas. In the Table:
US Gas price is the spot price at Henry Hub, Louisiana
Europe Gas price: from April 2015, Netherlands Title Transfer Facility (TTF); April 2010 to March 2015, average import border price and a spot price component, including UK; during June 2000 - March 2010 prices excludes UK
LNG Price Japan is the import price, cif; recent two months' averages are estimates
Natural gas index (Laspeyres), is the average of Europe, US and Japan (LNG), weights based on 5-year average consumption volumes, updated every 5 years, except the 11-year period 1960-70
For the year 2024, annual average US gas price was $ 2.2 / MMBTU, that in Europe was $ 11.0 / MMBTU while Japan LNG price was $ 12.8 / MMBTU. The price delta between European and US market was $ 8.8 / MMBTU, that between Japan LNG price and US was $ 10.7 / MMBTU while Japan LNG price delta to European price was $ 1.9 / MMBTU
| Year | Natural Gas Price US dollar per MMBTU | Natural Gas Price Europe dollar per MMBTU | LNG Price Japan dollar per MMBTU | Europe US Price Delta dollar per MMBTU | Japan US Price Delta dollar per MMBTU | Japan Europe Price Delta dollar per MMBTU |
|---|---|---|---|---|---|---|
| 2025 | 3.5 | 12.0 | 12.0 | 8.4 | 8.5 | 0.1 |
| 2024 | 2.2 | 11.0 | 12.8 | 8.8 | 10.7 | 1.9 |
| 2023 | 2.5 | 13.1 | 14.4 | 10.6 | 11.8 | 1.3 |
| 2022 | 6.4 | 40.3 | 18.4 | 34.0 | 12.1 | -21.9 |
| 2021 | 3.9 | 16.1 | 10.8 | 12.3 | 6.9 | -5.4 |
| 2020 | 2.0 | 3.2 | 8.3 | 1.2 | 6.3 | 5.1 |
| 2019 | 2.6 | 4.8 | 10.6 | 2.2 | 8.0 | 5.8 |
| 2018 | 3.2 | 7.7 | 10.7 | 4.5 | 7.5 | 3.0 |
| 2017 | 3.0 | 5.7 | 8.6 | 2.8 | 5.6 | 2.9 |
| 2016 | 2.5 | 4.6 | 7.4 | 2.1 | 4.9 | 2.8 |
| 2015 | 2.6 | 6.8 | 10.9 | 4.2 | 8.3 | 4.1 |
| 2014 | 4.4 | 10.1 | 16.0 | 5.7 | 11.7 | 6.0 |
| 2013 | 3.7 | 11.8 | 16.0 | 8.1 | 12.2 | 4.2 |
| 2012 | 2.8 | 11.5 | 16.6 | 8.7 | 13.8 | 5.1 |
| 2011 | 4.0 | 10.5 | 14.7 | 6.5 | 10.7 | 4.1 |
| 2010 | 4.4 | 8.3 | 10.8 | 3.9 | 6.5 | 2.6 |
| 2009 | 4.0 | 8.7 | 8.9 | 4.8 | 5.0 | 0.2 |
| 2008 | 8.9 | 13.4 | 12.5 | 4.5 | 3.7 | -0.9 |
| 2007 | 7.0 | 8.6 | 7.7 | 1.6 | 0.7 | -0.9 |
| 2006 | 6.7 | 8.5 | 7.1 | 1.8 | 0.4 | -1.4 |
| 2005 | 8.9 | 6.3 | 6.0 | -2.6 | -2.9 | -0.3 |
| 2004 | 5.9 | 4.3 | 5.1 | -1.6 | -0.8 | 0.9 |
| 2003 | 5.5 | 3.9 | 4.7 | -1.6 | -0.8 | 0.8 |
| 2002 | 3.4 | 3.1 | 4.3 | -0.3 | 0.9 | 1.2 |
| 2001 | 4.0 | 4.1 | 4.6 | 0.1 | 0.7 | 0.6 |
| 2000 | 4.3 | 3.9 | 4.7 | -0.5 | 0.4 | 0.9 |
| 1999 | 2.3 | 2.1 | 3.1 | -0.1 | 0.9 | 1.0 |
| 1998 | 2.1 | 2.4 | 3.0 | 0.3 | 0.9 | 0.6 |
| 1997 | 2.5 | 2.7 | 3.9 | 0.3 | 1.4 | 1.2 |
| 1996 | 2.7 | 2.8 | 3.7 | 0.1 | 0.9 | 0.8 |
| 1995 | 1.7 | 2.7 | 3.4 | 1.0 | 1.7 | 0.7 |
| 1994 | 1.9 | 2.4 | 3.2 | 0.5 | 1.3 | 0.7 |
| 1993 | 2.1 | 2.7 | 3.5 | 0.6 | 1.4 | 0.8 |
| 1992 | 1.8 | 2.6 | 3.6 | 0.8 | 1.8 | 1.0 |
| 1991 | 1.5 | 3.1 | 4.0 | 1.6 | 2.5 | 0.9 |
| 1990 | 1.7 | 2.8 | 3.6 | 1.1 | 1.9 | 0.8 |
| 1989 | 1.7 | 2.1 | 3.3 | 0.4 | 1.6 | 1.2 |
| 1988 | 1.7 | 2.4 | 3.3 | 0.7 | 1.7 | 1.0 |
| 1987 | 1.7 | 2.6 | 3.4 | 0.9 | 1.7 | 0.8 |
| 1986 | 1.9 | 3.7 | 4.1 | 1.7 | 2.2 | 0.5 |
| 1985 | 2.5 | 3.7 | 5.2 | 1.1 | 2.7 | 1.6 |
| 1984 | 2.7 | 3.8 | 5.2 | 1.1 | 2.6 | 1.5 |
| 1983 | 2.6 | 4.1 | 5.5 | 1.5 | 3.0 | 1.5 |
| 1982 | 2.5 | 4.5 | 6.1 | 2.0 | 3.6 | 1.6 |
| 1981 | 2.0 | 4.6 | 6.0 | 2.6 | 4.0 | 1.4 |
| 1980 | 1.6 | 4.2 | 5.7 | 2.6 | 4.1 | 1.5 |
| 1979 | 1.2 | 3.3 | 3.7 | 2.1 | 2.5 | 0.4 |
| 1978 | 0.9 | 2.3 | 3.0 | 1.4 | 2.1 | 0.7 |
| 1977 | 0.8 | 1.8 | 2.8 | 1.0 | 2.0 | 1.0 |
| 1976 | 0.6 | 1.7 | 1.2 | |||
| 1975 | 0.4 | 1.7 | 1.3 | |||
| 1974 | 0.3 | 1.7 | 1.4 | |||
| 1973 | 0.2 | 0.7 | 0.5 | |||
| 1972 | 0.2 | 0.5 | 0.4 | |||
| 1971 | 0.2 | 0.5 | 0.3 | |||
| 1970 | 0.2 | 0.4 | 0.3 | |||
| 1969 | 0.2 | 0.5 | 0.3 | |||
| 1968 | 0.2 | 0.5 | 0.3 | |||
| 1967 | 0.2 | 0.5 | 0.3 | |||
| 1966 | 0.2 | 0.4 | 0.3 | |||
| 1965 | 0.2 | 0.4 | 0.3 | |||
| 1964 | 0.2 | 0.4 | 0.2 | |||
| 1963 | 0.2 | 0.4 | 0.2 | |||
| 1962 | 0.2 | 0.4 | 0.2 | |||
| 1961 | 0.2 | 0.4 | 0.3 | |||
| 1960 | 0.1 | 0.4 | 0.3 |
View the trends graphically
Japan LNG prices are available since 1977. Till about 2005, the prices moved in a narrow range of $2.8-6.0/MMBTU, after which there was a breakout, and pries have been very volatile since then. Long-term contracts make up significant proportion of Japan's total LNG supply and have been typically linked to crude oil prices and have shown a strong correlation with oil prices. The spot prices have been often referenced by the Platts Japan/Korea Marker (JKM)
For the benefit of our readers, we present a simple 1977-2024 Average / Min / Max / Std Deviation statistics
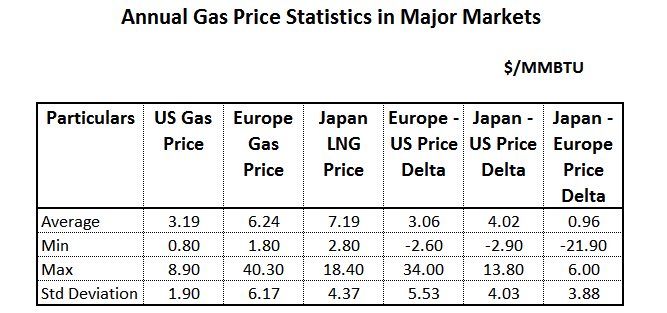
We have described results based on a more detailed analysis in our Monthly Gas Prices section
In 2022, European prices were extremely elevated, due to Ukraine crisis, before coming down to more common levels