Pumped Hydro Installed Capacity (GW)
Pumped Storage Hydropower (PSH), also called Water batteries for the renewable energy sector, is the largest form of renewable energy storage, with nearly 200 GW installed capacity providing more than 90% of all long duration energy storage across the world with over 400 projects in operation
When the grid has surplus power, water is pumped up to the higher reservoir (like charging the battery). Later, when demand increases and the supply decreases, the water is released to generate power (like discharging the battery)
The amount of energy a PSH project can store depends on the size and height difference of the two reservoirs it is made up of, while the amount of electricity it can produce at once depends on the size of the turbines
International Hydropower Association (IHA) gives an example: a facility with two reservoirs roughly the size of two Olympic swimming pools, and a 500 metre height difference between them, could provide a capacity of 3 megawatts (MW) and store up to 3.5 megawatt hours (MWh) of electricity. The Fengning Pumped Storage Power Station is the one of largest of its kind in the world, with twelve 300 MW reversible turbines, 40-60 GWh of energy storage and 11 hours of energy storage, their reservoirs are roughly comparable in size to about 20,000 to 40,000 Olympic swimming pools
IHA estimates that PSH projects worldwide store up to 9,000 gigawatt hours (GWh) of electricity
There are two principal categories of pumped storage projects, Open-loop pumped storage and Closed-loop pumped storage:
Open-loop pumped storage: With either an upper or lower reservoir that is continuously connected to a naturally flowing water source such as a river
Closed-loop pumped storage: An ‘off-river’ pumped storage site produces power from water pumped to an upper reservoir without a significant natural inflow
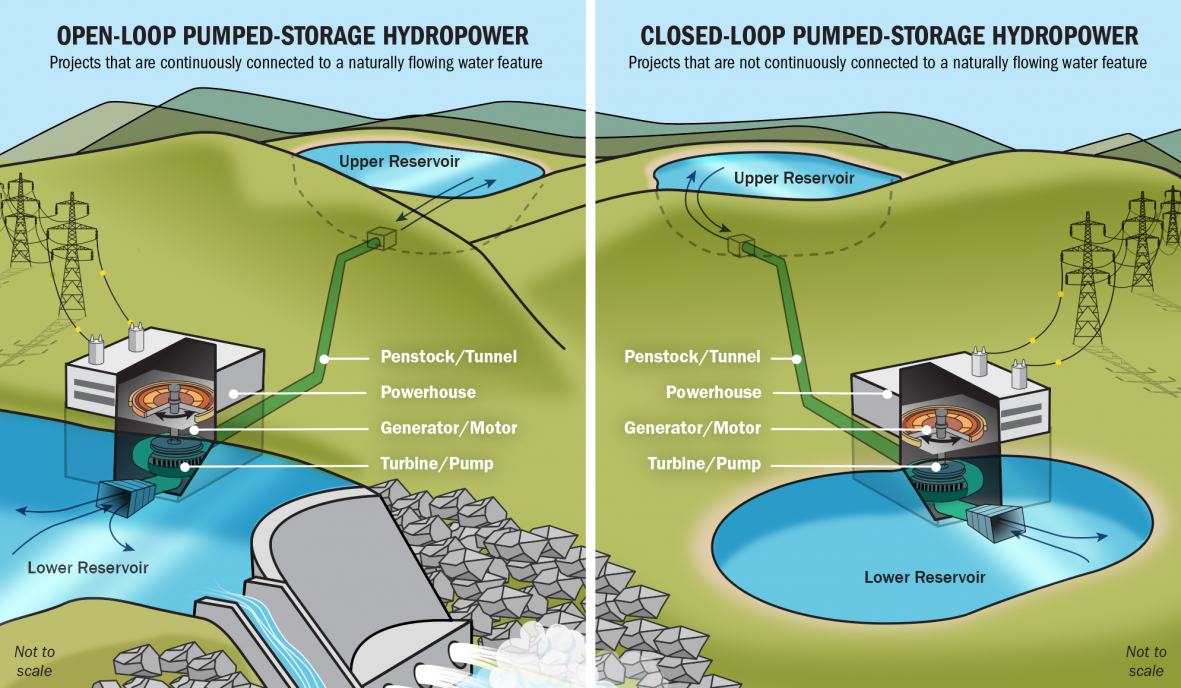
Table below captures country-wise trend in installed pumped hydro capacity
For 2023, world installed pumped hydro capacity was 190.9 GW, that for India was 4.8 GW, for China it was 50.9 GW while that of US was 23.1 GW
Japan has 27 GW of installed pumped hydro capacity
| Year | World | India | China | United States | Argentina | Australia | Austria | Belgium | Bosnia and Herzegovina | Bulgaria | Canada | Croatia | Czechia | Former Serbia and Montenegro | Former Yugoslavia | France | Germany | Greece | Iran | Iraq | Ireland | Israel | Italy | Japan | Lithuania | Luxembourg | Morocco | Norway | Philippines | Poland | Portugal | Romania | Russia | Serbia | Slovakia | Slovenia | South Africa | South Korea | Spain | Sweden | Switzerland | Taiwan | Thailand | Ukraine | United Kingdom |
|---|---|---|---|---|---|---|---|---|---|---|---|---|---|---|---|---|---|---|---|---|---|---|---|---|---|---|---|---|---|---|---|---|---|---|---|---|---|---|---|---|---|---|---|---|---|
| 2023 | 190.9 | 4.8 | 50.9 | 23.1 | 1.0 | 2.5 | 5.8 | 1.3 | 0.4 | 0.9 | 0.2 | 0.3 | 1.2 | 7.1 | 6.6 | 0.7 | 1.0 | 0.2 | 0.3 | 0.3 | 7.2 | 27.5 | 0.8 | 1.3 | 0.5 | 1.4 | 0.7 | 1.8 | 3.7 | 0.4 | 1.4 | 0.6 | 0.9 | 0.2 | 2.7 | 4.7 | 6.4 | 0.1 | 12.3 | 2.6 | 0.6 | 1.8 | 2.8 | ||
| 2022 | 186.0 | 4.8 | 45.8 | 23.0 | 1.0 | 2.6 | 5.8 | 1.3 | 0.4 | 1.0 | 0.2 | 0.3 | 1.2 | 7.1 | 6.5 | 0.7 | 1.0 | 0.2 | 0.3 | 0.3 | 7.3 | 27.4 | 0.8 | 1.3 | 0.5 | 1.4 | 0.7 | 1.8 | 3.6 | 0.4 | 1.4 | 0.7 | 0.9 | 0.2 | 2.7 | 4.7 | 6.4 | 0.1 | 12.3 | 2.6 | 0.6 | 1.8 | 2.9 | ||
| 2021 | 174.4 | 4.8 | 36.4 | 23.0 | 1.0 | 2.6 | 5.8 | 1.3 | 0.4 | 1.0 | 0.2 | 0.3 | 1.2 | 7.1 | 6.5 | 0.7 | 1.0 | 0.2 | 0.3 | 0.3 | 7.2 | 27.4 | 0.8 | 1.3 | 0.5 | 1.4 | 0.7 | 1.8 | 2.8 | 0.4 | 1.4 | 0.7 | 0.9 | 0.2 | 2.7 | 4.7 | 6.4 | 0.1 | 11.3 | 2.6 | 0.6 | 1.5 | 2.9 | ||
| 2020 | 167.5 | 4.8 | 30.3 | 23.0 | 1.0 | 2.6 | 5.7 | 1.3 | 0.4 | 1.0 | 0.2 | 0.3 | 1.2 | 7.1 | 6.5 | 0.7 | 1.0 | 0.2 | 0.3 | 0.3 | 7.3 | 27.5 | 0.8 | 1.3 | 0.5 | 1.5 | 0.7 | 1.8 | 2.8 | 0.4 | 1.2 | 0.6 | 0.9 | 0.2 | 2.7 | 4.7 | 6.4 | 0.1 | 10.7 | 2.6 | 0.6 | 1.5 | 2.9 | ||
| 2019 | 167.0 | 4.8 | 30.3 | 22.8 | 1.0 | 2.6 | 5.7 | 1.3 | 0.4 | 1.0 | 0.2 | 0.3 | 1.2 | 7.2 | 6.5 | 0.7 | 1.0 | 0.2 | 0.3 | 0.0 | 7.2 | 27.5 | 0.8 | 1.3 | 0.5 | 1.4 | 0.7 | 1.8 | 2.8 | 0.4 | 1.2 | 0.6 | 0.9 | 0.2 | 2.7 | 4.7 | 6.4 | 0.1 | 10.8 | 2.6 | 0.6 | 1.5 | 2.9 | ||
| 2018 | 166.7 | 4.8 | 30.0 | 22.8 | 1.0 | 2.6 | 5.7 | 1.3 | 0.4 | 1.0 | 0.2 | 0.3 | 1.2 | 7.1 | 6.5 | 0.7 | 1.0 | 0.2 | 0.3 | 0.0 | 7.3 | 27.5 | 0.8 | 1.3 | 0.5 | 1.4 | 0.7 | 1.8 | 2.8 | 0.4 | 1.2 | 0.6 | 0.9 | 0.2 | 2.7 | 4.7 | 6.4 | 0.1 | 10.8 | 2.6 | 0.6 | 1.5 | 2.9 | ||
| 2017 | 166.3 | 4.8 | 29.4 | 22.8 | 1.0 | 2.6 | 5.6 | 1.3 | 0.4 | 1.0 | 0.2 | 0.3 | 1.2 | 7.1 | 6.7 | 0.7 | 1.0 | 0.2 | 0.3 | 0.0 | 7.3 | 27.5 | 0.8 | 1.3 | 0.5 | 1.5 | 0.7 | 1.8 | 2.8 | 0.4 | 1.2 | 0.6 | 0.9 | 0.2 | 2.7 | 4.7 | 6.4 | 0.1 | 10.7 | 2.6 | 0.6 | 1.5 | 2.9 | ||
| 2016 | 162.5 | 4.8 | 26.7 | 22.8 | 1.0 | 2.6 | 5.6 | 1.3 | 0.4 | 1.0 | 0.2 | 0.3 | 1.2 | 7.1 | 6.8 | 0.7 | 1.0 | 0.2 | 0.3 | 0.0 | 7.3 | 27.5 | 0.8 | 1.3 | 0.5 | 1.5 | 0.7 | 1.8 | 2.5 | 0.4 | 1.2 | 0.6 | 0.9 | 0.2 | 2.4 | 4.7 | 6.4 | 0.1 | 10.2 | 2.6 | 0.6 | 1.4 | 2.9 | ||
| 2015 | 155.7 | 4.8 | 23.0 | 22.6 | 1.0 | 2.6 | 5.2 | 1.3 | 0.4 | 1.0 | 0.2 | 0.3 | 1.2 | 7.1 | 6.8 | 0.7 | 1.0 | 0.2 | 0.3 | 0.0 | 7.6 | 27.5 | 0.8 | 1.3 | 0.5 | 1.4 | 0.7 | 1.8 | 1.7 | 0.4 | 1.2 | 0.6 | 0.9 | 0.2 | 1.4 | 4.7 | 6.4 | 0.1 | 9.5 | 2.6 | 0.6 | 1.2 | 2.9 | ||
| 2014 | 153.3 | 4.8 | 22.1 | 22.5 | 1.0 | 2.6 | 5.2 | 1.3 | 0.4 | 1.0 | 0.2 | 0.3 | 1.2 | 7.2 | 6.8 | 0.7 | 0.5 | 0.2 | 0.3 | 0.0 | 7.6 | 27.3 | 0.8 | 1.3 | 0.5 | 1.4 | 0.7 | 1.8 | 1.3 | 0.4 | 1.2 | 0.6 | 0.9 | 0.2 | 1.4 | 4.7 | 6.4 | 0.1 | 9.4 | 2.6 | 0.6 | 1.2 | 2.7 | ||
| 2013 | 151.6 | 4.8 | 21.5 | 22.4 | 1.0 | 2.6 | 5.1 | 1.3 | 0.4 | 1.0 | 0.2 | 0.3 | 1.2 | 7.3 | 6.8 | 0.7 | 0.5 | 0.2 | 0.3 | 0.0 | 7.6 | 26.7 | 0.8 | 1.1 | 0.5 | 1.4 | 0.7 | 1.8 | 1.3 | 0.4 | 1.2 | 0.6 | 0.9 | 0.2 | 1.4 | 4.7 | 6.4 | 0.1 | 9.5 | 2.6 | 0.6 | 0.9 | 2.7 | ||
| 2012 | 148.6 | 4.8 | 20.3 | 22.4 | 1.0 | 2.6 | 5.1 | 1.3 | 0.4 | 1.0 | 0.2 | 0.3 | 1.1 | 7.3 | 6.8 | 0.7 | 0.0 | 0.2 | 0.3 | 0.0 | 7.6 | 26.7 | 0.8 | 1.1 | 0.5 | 1.4 | 0.7 | 1.8 | 1.3 | 0.1 | 1.2 | 0.6 | 0.9 | 0.2 | 1.4 | 4.7 | 5.5 | 0.1 | 9.5 | 2.6 | 0.6 | 0.9 | 2.7 | ||
| 2011 | 146.0 | 4.8 | 18.4 | 22.3 | 1.0 | 2.6 | 5.0 | 1.3 | 0.4 | 1.0 | 0.2 | 0.3 | 1.1 | 7.3 | 7.0 | 0.7 | 0.0 | 0.2 | 0.3 | 0.0 | 7.5 | 26.3 | 0.8 | 1.1 | 0.5 | 1.4 | 0.7 | 1.8 | 1.0 | 0.1 | 1.2 | 0.6 | 0.9 | 0.2 | 1.4 | 4.7 | 5.5 | 0.1 | 9.6 | 2.6 | 0.6 | 0.9 | 2.7 | ||
| 2010 | 142.4 | 4.8 | 16.9 | 22.2 | 1.0 | 2.6 | 4.8 | 1.3 | 0.4 | 1.0 | 0.2 | 0.3 | 1.1 | 7.3 | 7.0 | 0.6 | 0.0 | 0.2 | 0.3 | 0.0 | 7.5 | 25.4 | 0.8 | 1.1 | 0.5 | 1.3 | 0.7 | 1.8 | 1.0 | 0.1 | 1.2 | 0.6 | 0.9 | 0.2 | 1.4 | 3.9 | 5.5 | 0.1 | 9.6 | 2.6 | 0.6 | 0.9 | 2.7 | ||
| 2009 | 138.4 | 4.8 | 13.7 | 22.2 | 1.0 | 2.6 | 4.6 | 1.3 | 0.4 | 1.0 | 0.2 | 0.3 | 1.1 | 7.0 | 7.0 | 0.6 | 0.0 | 0.2 | 0.3 | 0.0 | 7.5 | 25.5 | 0.8 | 1.1 | 0.5 | 1.4 | 0.7 | 1.8 | 1.0 | 0.1 | 1.2 | 0.6 | 0.9 | 0.0 | 1.4 | 3.9 | 5.5 | 0.1 | 9.4 | 2.6 | 0.6 | 0.9 | 2.7 | ||
| 2008 | 133.7 | 4.8 | 10.2 | 21.9 | 1.0 | 2.6 | 4.4 | 1.3 | 0.4 | 1.0 | 0.2 | 0.3 | 1.1 | 7.0 | 6.7 | 0.7 | 0.0 | 0.2 | 0.3 | 0.0 | 7.5 | 25.5 | 0.8 | 1.1 | 0.5 | 1.4 | 0.7 | 1.8 | 1.0 | 0.0 | 1.2 | 0.6 | 0.9 | 0.0 | 1.4 | 3.9 | 5.5 | 0.1 | 9.3 | 2.6 | 0.6 | 0.4 | 2.7 | ||
| 2007 | 131.4 | 4.1 | 8.9 | 21.9 | 1.0 | 2.6 | 4.0 | 1.3 | 0.4 | 1.0 | 0.2 | 0.3 | 1.1 | 7.1 | 6.8 | 0.7 | 0.0 | 0.2 | 0.3 | 0.0 | 7.5 | 25.5 | 0.8 | 1.1 | 0.5 | 1.3 | 0.7 | 1.8 | 1.0 | 0.0 | 1.2 | 0.6 | 0.9 | 0.0 | 1.4 | 3.9 | 5.5 | 0.0 | 9.4 | 2.6 | 0.6 | 0.4 | 2.7 | ||
| 2006 | 127.2 | 3.6 | 6.2 | 21.5 | 1.0 | 2.6 | 4.0 | 1.3 | 0.4 | 1.0 | 0.2 | 0.3 | 1.1 | 7.1 | 6.7 | 0.7 | 0.0 | 0.2 | 0.3 | 0.0 | 7.5 | 25.2 | 0.8 | 1.1 | 0.5 | 1.3 | 0.7 | 1.8 | 1.0 | 0.0 | 1.2 | 0.6 | 0.9 | 0.0 | 1.4 | 3.9 | 5.5 | 0.0 | 9.3 | 2.6 | 0.6 | 0.2 | 2.7 | ||
| 2005 | 124.1 | 3.2 | 5.6 | 21.3 | 1.0 | 2.6 | 4.0 | 1.3 | 0.4 | 1.0 | 0.2 | 0.3 | 1.1 | 0.6 | 7.1 | 6.7 | 0.7 | 0.0 | 0.2 | 0.3 | 0.0 | 7.1 | 25.2 | 0.8 | 1.1 | 0.5 | 1.3 | 0.7 | 1.8 | 1.0 | 0.0 | 1.2 | 0.9 | 0.0 | 1.4 | 2.3 | 5.5 | 0.0 | 9.3 | 2.6 | 0.6 | 0.2 | 2.8 | ||
| 2004 | 119.0 | 2.4 | 5.0 | 20.8 | 1.0 | 1.4 | 4.0 | 1.3 | 0.4 | 1.0 | 0.2 | 0.3 | 1.1 | 0.6 | 7.1 | 5.9 | 0.7 | 0.0 | 0.2 | 0.3 | 0.0 | 7.0 | 24.7 | 0.8 | 1.1 | 0.2 | 1.3 | 0.7 | 1.7 | 0.9 | 0.0 | 1.1 | 0.9 | 0.0 | 1.4 | 2.3 | 5.5 | 0.0 | 9.3 | 2.6 | 0.6 | 0.2 | 2.8 | ||
| 2003 | 117.1 | 2.4 | 5.0 | 20.5 | 1.0 | 1.5 | 3.9 | 1.3 | 0.4 | 1.0 | 0.2 | 0.3 | 1.1 | 0.6 | 7.2 | 5.2 | 0.7 | 0.0 | 0.2 | 0.3 | 0.0 | 7.0 | 24.7 | 0.8 | 1.1 | 0.0 | 1.0 | 0.3 | 1.7 | 0.6 | 0.0 | 1.2 | 0.9 | 0.0 | 1.4 | 2.3 | 5.5 | 0.0 | 9.3 | 2.6 | 0.6 | 0.2 | 2.8 | ||
| 2002 | 117.0 | 2.1 | 5.0 | 20.4 | 1.0 | 1.5 | 3.9 | 1.3 | 0.4 | 1.0 | 0.2 | 0.3 | 1.1 | 0.6 | 7.2 | 5.4 | 0.7 | 0.0 | 0.2 | 0.3 | 0.0 | 7.0 | 24.7 | 0.8 | 1.1 | 0.0 | 1.3 | 0.3 | 1.7 | 0.6 | 0.0 | 1.2 | 0.9 | 0.0 | 1.4 | 2.3 | 5.5 | 0.0 | 9.2 | 2.6 | 0.6 | 0.2 | 2.8 | ||
| 2001 | 115.9 | 1.7 | 5.0 | 19.7 | 1.0 | 1.5 | 3.9 | 1.3 | 0.4 | 1.0 | 0.2 | 0.3 | 1.1 | 0.6 | 7.2 | 5.3 | 0.7 | 0.0 | 0.2 | 0.3 | 0.0 | 7.0 | 24.7 | 0.8 | 1.1 | 0.0 | 1.4 | 0.3 | 1.7 | 0.6 | 0.0 | 1.2 | 0.9 | 0.0 | 1.4 | 2.3 | 5.5 | 0.0 | 9.3 | 2.6 | 0.5 | 0.2 | 2.8 | ||
| 2000 | 114.3 | 1.5 | 5.0 | 19.5 | 1.0 | 1.5 | 3.9 | 1.3 | 0.4 | 1.0 | 0.2 | 0.3 | 1.1 | 0.6 | 7.2 | 5.4 | 0.7 | 0.0 | 0.2 | 0.3 | 0.0 | 7.0 | 24.3 | 0.8 | 1.1 | 0.0 | 1.4 | 0.3 | 1.7 | 0.6 | 0.0 | 1.2 | 0.7 | 0.0 | 1.4 | 1.6 | 5.5 | 0.0 | 9.3 | 2.6 | 0.5 | 0.2 | 2.8 | ||
| 1999 | 107.6 | 1.6 | 3.5 | 19.6 | 1.0 | 1.5 | 1.8 | 1.3 | 0.4 | 0.2 | 0.3 | 1.1 | 0.6 | 7.2 | 5.5 | 0.6 | 0.0 | 0.2 | 0.3 | 0.0 | 7.0 | 24.3 | 0.0 | 1.1 | 0.0 | 0.7 | 0.3 | 1.4 | 0.6 | 0.0 | 1.2 | 0.7 | 0.0 | 1.4 | 1.6 | 5.1 | 0.0 | 9.6 | 2.6 | 0.5 | 2.8 | ||||
| 1998 | 105.1 | 1.6 | 2.3 | 19.5 | 1.0 | 1.5 | 1.8 | 1.3 | 0.4 | 0.2 | 0.3 | 1.1 | 0.6 | 7.1 | 5.9 | 0.6 | 0.0 | 0.2 | 0.3 | 0.0 | 7.0 | 23.9 | 0.0 | 1.1 | 0.0 | 0.7 | 0.3 | 1.4 | 0.6 | 0.0 | 1.2 | 0.7 | 0.0 | 1.4 | 1.6 | 5.1 | 0.1 | 8.4 | 2.6 | 0.5 | 2.8 | ||||
| 1997 | 101.5 | 1.6 | 2.0 | 19.3 | 1.0 | 0.9 | 1.8 | 1.3 | 0.4 | 0.2 | 0.3 | 1.1 | 0.6 | 7.1 | 4.5 | 0.3 | 0.0 | 0.2 | 0.3 | 0.0 | 6.9 | 23.2 | 0.0 | 1.1 | 0.0 | 0.7 | 0.3 | 1.4 | 0.6 | 0.0 | 1.2 | 0.7 | 0.0 | 1.4 | 1.6 | 5.1 | 0.1 | 8.3 | 2.6 | 0.5 | 2.8 | ||||
| 1996 | 103.3 | 1.6 | 1.6 | 21.1 | 1.0 | 0.9 | 1.8 | 1.3 | 0.4 | 0.0 | 0.2 | 0.3 | 1.1 | 0.6 | 7.1 | 4.6 | 0.3 | 0.0 | 0.2 | 0.3 | 0.0 | 6.9 | 23.2 | 0.0 | 1.1 | 0.0 | 0.7 | 0.3 | 1.4 | 0.6 | 0.0 | 1.2 | 0.7 | 0.0 | 1.4 | 1.6 | 5.1 | 0.4 | 8.3 | 2.6 | 0.5 | 2.8 | |||
| 1995 | 101.6 | 1.6 | 1.4 | 21.4 | 1.0 | 0.9 | 1.8 | 1.3 | 0.4 | 0.0 | 0.2 | 0.3 | 0.5 | 0.6 | 7.1 | 4.5 | 0.3 | 0.0 | 0.2 | 0.3 | 0.0 | 6.9 | 22.3 | 0.0 | 1.1 | 0.0 | 0.7 | 0.3 | 1.4 | 0.6 | 0.0 | 1.2 | 0.7 | 0.0 | 1.4 | 1.6 | 5.1 | 0.4 | 8.3 | 2.6 | 0.4 | 2.8 | |||
| 1994 | 99.2 | 1.3 | 1.2 | 21.2 | 1.0 | 0.9 | 1.8 | 1.3 | 0.4 | 0.0 | 0.2 | 0.3 | 0.5 | 0.6 | 7.1 | 4.6 | 0.3 | 0.0 | 0.2 | 0.3 | 0.0 | 6.9 | 20.9 | 0.0 | 1.1 | 0.0 | 1.1 | 0.3 | 1.4 | 0.6 | 0.0 | 1.2 | 0.7 | 0.0 | 1.4 | 1.0 | 4.9 | 0.4 | 8.3 | 2.6 | 0.4 | 2.8 | |||
| 1993 | 95.1 | 1.3 | 0.6 | 21.1 | 1.0 | 0.9 | 1.8 | 1.3 | 0.4 | 0.0 | 0.2 | 0.3 | 0.5 | 0.6 | 7.1 | 5.8 | 0.3 | 0.0 | 0.2 | 0.3 | 0.0 | 6.9 | 18.9 | 0.0 | 1.1 | 0.0 | 1.1 | 0.3 | 1.4 | 0.6 | 0.0 | 1.2 | 0.7 | 0.0 | 1.4 | 4.9 | 0.4 | 8.2 | 1.0 | 0.4 | 2.8 | ||||
| 1992 | 90.2 | 1.3 | 21.2 | 1.0 | 0.9 | 1.8 | 1.3 | 0.4 | 0.0 | 0.2 | 0.3 | 0.6 | 7.1 | 4.6 | 0.3 | 0.0 | 0.2 | 0.3 | 0.0 | 6.6 | 18.5 | 0.0 | 1.1 | 0.0 | 1.1 | 0.3 | 1.4 | 0.6 | 0.0 | 0.0 | 0.0 | 1.4 | 4.9 | 0.4 | 8.2 | 1.0 | 0.4 | 2.8 | |||||||
| 1991 | 85.9 | 1.3 | 18.4 | 1.0 | 0.9 | 1.8 | 1.3 | 0.0 | 0.2 | 0.6 | 7.1 | 4.5 | 0.3 | 0.0 | 0.2 | 0.3 | 0.0 | 6.4 | 18.2 | 1.1 | 0.0 | 1.1 | 0.3 | 1.2 | 0.6 | 0.0 | 1.4 | 4.9 | 0.4 | 8.2 | 1.0 | 0.4 | 2.8 | ||||||||||||
| 1990 | 80.8 | 1.3 | 19.5 | 1.0 | 0.9 | 1.8 | 1.3 | 0.0 | 0.2 | 0.6 | 7.0 | 0.3 | 0.0 | 0.2 | 0.3 | 0.0 | 6.2 | 17.0 | 1.1 | 0.0 | 1.1 | 0.3 | 1.2 | 0.6 | 0.0 | 1.4 | 4.9 | 0.4 | 8.2 | 1.0 | 0.2 | 2.8 | |||||||||||||
| 1989 | 65.9 | 1.1 | 18.1 | 1.0 | 1.3 | 0.0 | 0.6 | 4.2 | 0.3 | 0.0 | 0.2 | 0.3 | 0.0 | 5.7 | 17.0 | 1.1 | 0.0 | 1.1 | 0.3 | 1.3 | 0.6 | 0.0 | 1.4 | 4.3 | 0.4 | 1.5 | 1.0 | 0.2 | 2.8 | ||||||||||||||||
| 1988 | 42.9 | 1.1 | 1.0 | 1.2 | 0.0 | 0.6 | 4.2 | 0.3 | 0.0 | 0.0 | 0.3 | 0.0 | 5.4 | 16.2 | 1.1 | 0.0 | 1.0 | 0.3 | 1.2 | 0.6 | 0.0 | 1.4 | 4.3 | 1.5 | 1.0 | 0.2 | |||||||||||||||||||
| 1987 | 41.8 | 1.1 | 1.0 | 1.2 | 0.0 | 0.6 | 4.1 | 0.3 | 0.0 | 0.0 | 0.3 | 0.0 | 5.4 | 15.6 | 1.1 | 0.0 | 1.0 | 0.3 | 1.3 | 0.4 | 0.0 | 1.0 | 4.3 | 1.5 | 1.0 | 0.2 | |||||||||||||||||||
| 1986 | 38.6 | 0.7 | 1.0 | 1.2 | 0.0 | 0.6 | 3.0 | 0.3 | 0.0 | 0.0 | 0.3 | 0.0 | 5.4 | 14.4 | 1.1 | 0.0 | 1.0 | 0.3 | 1.3 | 0.3 | 0.0 | 1.0 | 3.9 | 1.5 | 1.0 | 0.2 | |||||||||||||||||||
| 1985 | 36.3 | 0.7 | 0.0 | 1.2 | 0.0 | 0.6 | 2.6 | 0.2 | 0.0 | 0.0 | 0.3 | 0.0 | 5.7 | 14.4 | 1.1 | 0.0 | 0.3 | 0.3 | 1.3 | 0.3 | 0.0 | 1.0 | 3.6 | 1.4 | 1.0 | 0.2 | |||||||||||||||||||
| 1984 | 34.2 | 0.7 | 0.0 | 1.2 | 0.0 | 0.6 | 2.5 | 0.0 | 0.0 | 0.0 | 0.3 | 0.0 | 5.2 | 14.1 | 1.1 | 0.0 | 0.3 | 0.3 | 1.3 | 0.0 | 1.0 | 3.1 | 1.4 | 1.0 | 0.0 | ||||||||||||||||||||
| 1983 | 27.9 | 0.7 | 0.0 | 1.2 | 0.0 | 0.6 | 2.5 | 0.0 | 0.0 | 0.0 | 0.3 | 0.0 | 14.0 | 1.1 | 0.0 | 0.3 | 0.3 | 1.3 | 0.0 | 1.0 | 3.1 | 1.4 | 0.0 | 0.0 | |||||||||||||||||||||
| 1982 | 25.8 | 0.7 | 0.0 | 1.2 | 0.0 | 0.6 | 2.5 | 0.0 | 0.0 | 0.0 | 0.3 | 0.0 | 12.6 | 1.1 | 0.0 | 0.3 | 0.0 | 1.2 | 0.0 | 1.0 | 2.8 | 1.4 | 0.0 | 0.0 | |||||||||||||||||||||
| 1981 | 23.4 | 0.7 | 0.0 | 1.1 | 0.0 | 0.0 | 1.6 | 0.0 | 0.0 | 0.0 | 0.3 | 0.0 | 12.6 | 1.1 | 0.0 | 0.3 | 0.0 | 0.7 | 0.0 | 1.0 | 2.6 | 1.4 | 0.0 | 0.0 | |||||||||||||||||||||
| 1980 | 18.7 | 0.7 | 0.0 | 1.1 | 0.0 | 0.0 | 1.6 | 0.0 | 0.0 | 0.0 | 0.3 | 0.0 | 11.5 | 1.1 | 0.0 | 0.3 | 0.0 | 0.7 | 0.0 | 0.0 | 1.4 | 0.0 | 0.0 |
View the trends graphically
Pumped Storage Capacity Additions
(Source: IHA)
As per The International Hydropower Association's 2025 World Hydropower Outlook Report, more than 105 GW of PSH is under construction globally, with over 90 GW in China alone. While China has set a national target to commission 120 GW of pumped storage by 2030, twice the size of its current fleet, system operators China State Grid and Southern State Grid forecast a combined delivery of 129 GW within their operating areas. Based on this, IHA estimates that around 70 GW of China’s under construction capacity could be commissioned by 2030
India represents a significant share of the remaining PSH pipeline, with a national target of 26GW by 2032. It is likely that some of India’s approved projects will be completed before 2030, in addition to the 4.5 GW already being built
A number of approved projects in Europe and North America may also be completed by 2030
In total, an estimated 90 GW of PSH could be added by 2030, bringing the global capacity to around 280 GW. From the existing installed base of 189 GW, this would represent a nearly 50% increase. At 18 GW per year, the projected build rate is also five to ten times greater than the 2–4GW added annually over the past two decades