Base Metals: Annual Prices ($/tonne)
(Data Source: World Bank Commodity Markets section)
Base Metals covered by World Bank include, Aluminum, Iron ore, Copper, Lead, Tin, Nickel and Zinc
The basis of annual prices is:
Aluminum (LME) London Metal Exchange, unalloyed primary ingots, high grade, minimum 99.7% purity, settlement price beginning 2005; previously cash price
Copper (LME), grade A, minimum 99.9935% purity, cathodes and wire bar shapes, settlement price
Iron ore, spot in US dollar/dry ton and contract in US cents/dmtu. For years 2008 (December) to present, spot, (any origin) fines, 62% Fe, c.f.r. China; during 2006 to 2008 (November) spot, 63.5%Fe. Earlier data refer to annual contract prices (Brazil for Europe,) VALE Carajas mines sinter feed, f.o.b. Ponta da Madeira during years 1987-2009; Itabira mines f.o.b. Tubarão for years 1960-86. Unit dmtu denotes dry metric ton unit , i.e. 1% Fe-unit.
Iron ore (any origin) fines, spot price, c.f.r. China, 62% Fe beginning December 2008; previously 63.5%
Lead (LME), refined, 99.97% purity, settlement price
Nickel (LME), cathodes, minimum 99.8% purity, settlement price beginning 2005; previously cash price
Tin (LME), refined, 99.85% purity, settlement price
Zinc (LME), high grade, minimum 99.95% purity, settlement price beginning April 1990; previously special high grade, minimum 99.995%, cash prices
| Year | Aluminum dollar per ton | Iron ore cfr spot dollar per dmtu | Copper dollar per ton | Lead dollar per ton | Tin dollar per ton | Nickel dollar per ton | Zinc dollar per ton |
|---|---|---|---|---|---|---|---|
| 2025 | 2631.7 | 100.2 | 9947.3 | 1962.2 | 34058.8 | 15162.2 | 2867.5 |
| 2024 | 2419.0 | 109.4 | 9142.1 | 2069.5 | 30066.3 | 16814.0 | 2775.8 |
| 2023 | 2255.7 | 120.6 | 8490.3 | 2135.8 | 25938.1 | 21521.1 | 2652.6 |
| 2022 | 2705.0 | 121.3 | 8822.4 | 2150.6 | 31335.4 | 25833.7 | 3481.4 |
| 2021 | 2472.9 | 161.7 | 9317.1 | 2200.4 | 32384.2 | 18465.0 | 3002.5 |
| 2020 | 1704.0 | 108.9 | 6173.8 | 1824.9 | 17124.6 | 13787.3 | 2266.5 |
| 2019 | 1794.5 | 93.9 | 6010.2 | 1996.5 | 18661.2 | 13913.9 | 2550.4 |
| 2018 | 2108.5 | 69.8 | 6529.8 | 2240.4 | 20145.2 | 13114.1 | 2922.4 |
| 2017 | 1967.7 | 71.8 | 6169.9 | 2314.7 | 20061.2 | 10409.6 | 2890.9 |
| 2016 | 1604.2 | 58.4 | 4867.9 | 1866.7 | 17933.8 | 9595.2 | 2090.0 |
| 2015 | 1664.7 | 55.9 | 5510.5 | 1787.8 | 16066.6 | 11862.6 | 1931.7 |
| 2014 | 1867.4 | 97.0 | 6863.4 | 2095.5 | 21898.9 | 16893.4 | 2161.0 |
| 2013 | 1846.7 | 135.4 | 7332.1 | 2139.8 | 22282.8 | 15031.8 | 1910.3 |
| 2012 | 2023.3 | 128.5 | 7962.4 | 2064.6 | 21126.0 | 17547.6 | 1950.4 |
| 2011 | 2401.4 | 167.8 | 8828.2 | 2400.8 | 26053.7 | 22910.4 | 2193.9 |
| 2010 | 2173.1 | 145.9 | 7534.8 | 2148.5 | 20405.6 | 21808.9 | 2160.7 |
| 2009 | 1664.8 | 80.0 | 5149.7 | 1719.3 | 13573.9 | 14654.6 | 1655.1 |
| 2008 | 2572.8 | 156.0 | 6955.9 | 2090.7 | 18510.1 | 21110.6 | 1874.7 |
| 2007 | 2638.2 | 123.0 | 7118.2 | 2580.0 | 14536.8 | 37229.8 | 3242.4 |
| 2006 | 2569.9 | 69.3 | 6722.1 | 1289.7 | 8780.8 | 24254.4 | 3275.3 |
| 2005 | 1898.3 | 65.0 | 3678.9 | 976.4 | 7379.8 | 14744.0 | 1381.3 |
| 2004 | 1715.5 | 37.9 | 2865.9 | 886.6 | 8512.7 | 13823.2 | 1047.8 |
| 2003 | 1431.3 | 32.0 | 1779.1 | 515.0 | 4894.9 | 9629.5 | 827.7 |
| 2002 | 1349.9 | 29.3 | 1559.5 | 452.7 | 4060.5 | 6771.8 | 778.8 |
| 2001 | 1443.6 | 30.0 | 1578.3 | 476.2 | 4484.4 | 5944.7 | 885.8 |
| 2000 | 1549.1 | 28.8 | 1813.5 | 453.9 | 5435.7 | 8637.7 | 1128.1 |
| 1999 | 1361.1 | 27.6 | 1572.9 | 502.6 | 5403.6 | 6011.2 | 1076.3 |
| 1998 | 1357.5 | 31.0 | 1654.1 | 528.6 | 5540.3 | 4629.5 | 1024.5 |
| 1997 | 1599.3 | 30.2 | 2276.8 | 624.2 | 5646.8 | 6927.4 | 1316.1 |
| 1996 | 1505.7 | 30.0 | 2294.9 | 774.3 | 6165.1 | 7500.8 | 1025.1 |
| 1995 | 1805.7 | 28.4 | 2935.6 | 631.0 | 6213.8 | 8228.0 | 1031.1 |
| 1994 | 1476.8 | 26.5 | 2307.4 | 547.8 | 5463.9 | 6339.8 | 997.7 |
| 1993 | 1139.1 | 29.1 | 1913.1 | 406.4 | 5161.1 | 5293.4 | 962.0 |
| 1992 | 1254.3 | 33.1 | 2281.2 | 541.4 | 6101.0 | 7001.2 | 1239.8 |
| 1991 | 1302.2 | 34.8 | 2338.8 | 557.6 | 5595.0 | 8155.6 | 1117.0 |
| 1990 | 1639.5 | 32.5 | 2661.5 | 810.5 | 6085.4 | 8864.1 | 1513.5 |
| 1989 | 1951.3 | 27.8 | 2848.4 | 673.5 | 8534.4 | 13308.2 | 1658.8 |
| 1988 | 2550.5 | 24.3 | 2601.7 | 656.2 | 7051.6 | 13778.3 | 1241.5 |
| 1987 | 1565.4 | 25.3 | 1782.5 | 596.8 | 6664.8 | 4872.2 | 798.8 |
| 1986 | 1149.9 | 26.3 | 1373.8 | 406.1 | 6161.4 | 3881.2 | 754.0 |
| 1985 | 1040.7 | 26.6 | 1417.4 | 390.9 | 11539.0 | 4899.0 | 783.4 |
| 1984 | 1251.3 | 26.2 | 1377.3 | 442.6 | 12233.5 | 4752.2 | 921.9 |
| 1983 | 1438.4 | 29.0 | 1591.9 | 425.3 | 12988.0 | 4672.8 | 764.3 |
| 1982 | 991.6 | 32.5 | 1480.4 | 545.6 | 12825.8 | 4837.5 | 744.8 |
| 1981 | 1262.7 | 28.1 | 1742.0 | 726.7 | 14159.1 | 5953.1 | 845.7 |
| 1980 | 1774.9 | 28.1 | 2182.1 | 905.8 | 16774.9 | 6518.7 | 761.2 |
| 1979 | 1602.9 | 23.5 | 1985.3 | 1208.3 | 15447.4 | 5986.0 | 741.7 |
| 1978 | 1324.9 | 21.5 | 1364.8 | 661.9 | 12875.2 | 4609.3 | 593.9 |
| 1977 | 1143.8 | 23.1 | 1308.8 | 618.0 | 10804.5 | 5118.2 | 589.7 |
| 1976 | 889.9 | 22.7 | 1400.8 | 446.4 | 7585.5 | 4973.1 | 711.4 |
| 1975 | 868.4 | 17.3 | 1234.8 | 411.7 | 6876.6 | 4571.3 | 745.2 |
| 1974 | 764.8 | 13.4 | 2058.5 | 592.3 | 8184.3 | 3825.3 | 1239.6 |
| 1973 | 599.1 | 10.3 | 1785.4 | 429.7 | 4802.2 | 3373.1 | 845.3 |
| 1972 | 590.1 | 10.3 | 1057.7 | 301.7 | 3740.0 | 3079.9 | 377.7 |
| 1971 | 628.0 | 10.3 | 1081.4 | 253.6 | 3512.0 | 2932.1 | 309.3 |
| 1970 | 614.2 | 9.8 | 1415.7 | 302.9 | 3673.5 | 2846.2 | 295.8 |
| 1969 | 588.5 | 9.8 | 1467.3 | 289.9 | 3427.5 | 2363.4 | 286.4 |
| 1968 | 553.0 | 8.8 | 1242.0 | 240.5 | 3126.9 | 2074.5 | 262.9 |
| 1967 | 540.1 | 8.9 | 1134.8 | 227.7 | 3308.0 | 1935.7 | 273.3 |
| 1966 | 540.1 | 9.5 | 1531.5 | 260.7 | 3573.5 | 1739.0 | 281.1 |
| 1965 | 540.1 | 10.7 | 1292.8 | 317.2 | 3890.8 | 1735.0 | 311.3 |
| 1964 | 526.0 | 10.2 | 969.8 | 277.9 | 3412.7 | 1741.7 | 326.5 |
| 1963 | 498.8 | 11.0 | 646.0 | 174.8 | 2507.7 | 1741.7 | 211.5 |
| 1962 | 498.1 | 11.0 | 645.1 | 155.3 | 2471.4 | 1761.0 | 185.9 |
| 1961 | 511.5 | 11.0 | 633.1 | 177.0 | 2449.9 | 1711.0 | 214.3 |
| 1960 | 511.5 | 11.4 | 678.8 | 198.9 | 2196.7 | 1631.0 | 246.2 |
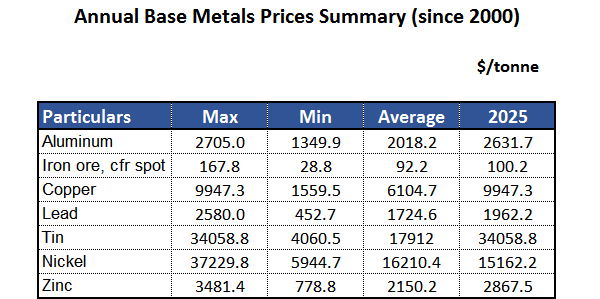
Base Metals Prices Summary
Table below captures Maximum / Minimun / Average of prices of various Base Metals since 2000, along with the latest prices