FADA Releases FY`26 and March`26 Vehicle Retail Data
6th April 2026
The Federation of Automobile Dealers Associations (FADA) has released Vehicle Retail Data for March`26 and FY 2025-26. FY 2025-26 has been a landmark year for Indian auto retail — delivering an all-time high of 2,96,71,064 units (29.67 million or 2.97 crore units) with a broad-based 13.30% YoY growth that saw five of six vehicle categories set new annual records
FADA has said, this is not just a number — it represents the industry approaching the 3-crore mark, a milestone that would have seemed distant just two years ago. What makes this year particularly significant is that the growth was structurally sound, underpinned by improving affordability, widening mobility demand across urban and rural India, and a diversifying powertrain mix
Category-wise, Two-Wheelers reclaimed their pre-COVID peak, retailing over 2.14 crore units and growing 13.40% — a recovery that had been long awaited and was finally unlocked by the combination of GST-led affordability, improved rural cash flows, and a broadening product portfolio that catered to both entry-level and aspirational segments
Passenger Vehicles crossed the 47-lakh mark for the first time, growing 13.00%, supported by a rich new-model pipeline, steady urbanisation, and the sustained shift towards SUVs and alternative powertrains
Tractors were the year’s standout performer, crossing 10 lakh retail units for the first time in history at 18.95% growth — a direct reflection of an excellent monsoon, strong rabi sowing, and improving farm economics
Commercial Vehicles recorded best ever figures and above the 10-lakh mark for the first time at 11.74% growth, led by infrastructure-driven freight demand and a particularly strong MCV sub-segment
Three-Wheelers set their third consecutive annual record at 11.68% growth, with the EV transition now accounting for over 60% of the segment’s retail
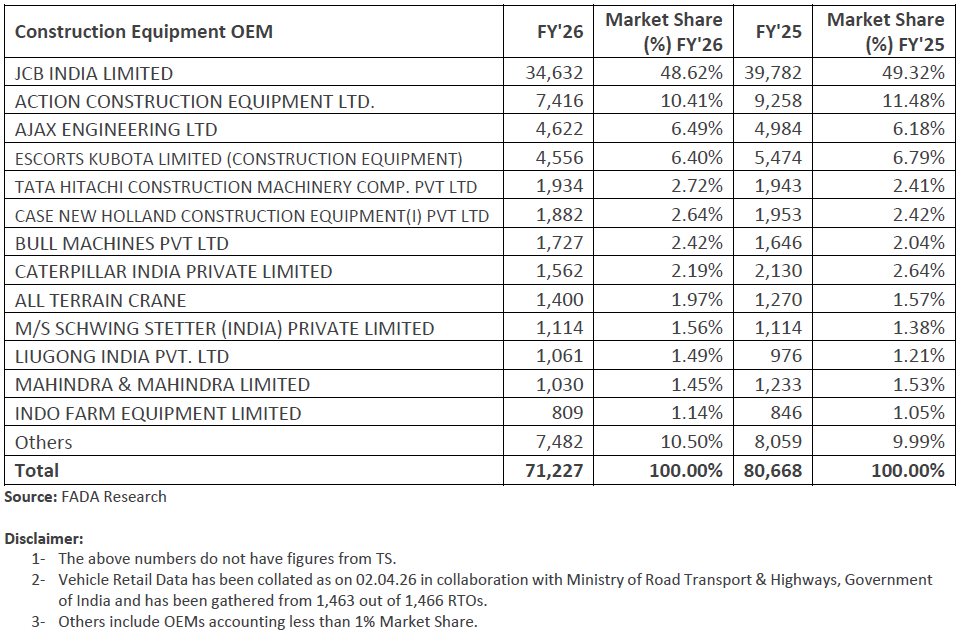
Construction Equipment was the sole exception, declining 11.70% as project-level delays and a high base weighed on volumes
The powertrain transition deepened through the year. EV share improved in every major category — 2W EV rose to 6.54%, PV EV rose to 4.25%, and CV EV nearly doubled to 1.83%. CNG strengthened its foothold in PVs at 21.98% and in CVs at 11.79%. The total EV retail for the year stood at 24.52 lakh units, a 24.63% expansion, signalling that the transition is no longer directional but substantive
On the demand-side, rural India continued to narrow the gap with urban markets. For FY’26, total rural retail grew 13.05% against 13.62% in urban — a near-parity that reflects the expanding aspirational footprint of auto retail in the hinterland, aided by better rural incomes, improving road connectivity, and increasing last-mile mobility needs. Within PVs, rural demand outpaced urban meaningfully at 17.12% versus 10.43%
Founded in 1964, FADA is the apex national body of Automobile Retail Industry in India engaged in the sale, service and spares of 2 & 3 Wheelers, Passenger Cars, UVs, Commercial Vehicles (including buses and trucks) and Tractors. FADA India represents over 15,000 Automobile Dealerships having over 30,000 dealership outlets including multiple Associations of Automobile Dealers at the Regional, State and City levels representing the entire Auto Retail Industry
The entire data that we have captured below for FY'2026 is from FADA's press release
Table below captures All India Vehicle Retail Data
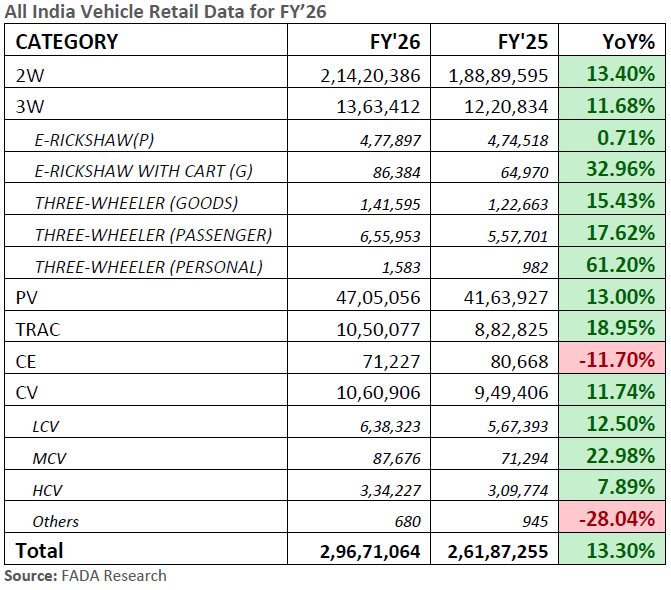
Table below captures All India Vehicle Retail EV Penetration
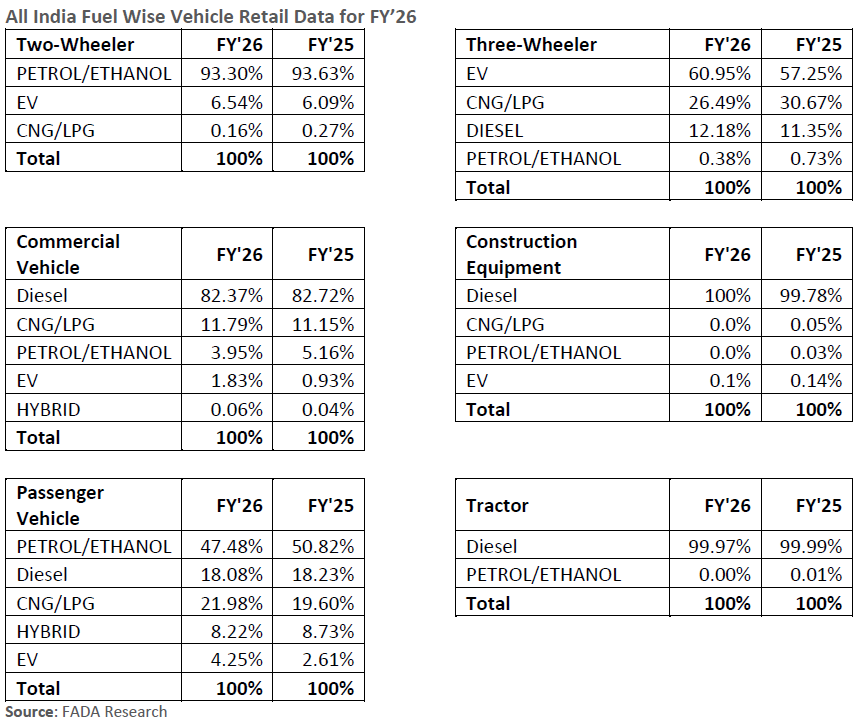
Table below captures OEM wise Market Share: 2 Wheelers
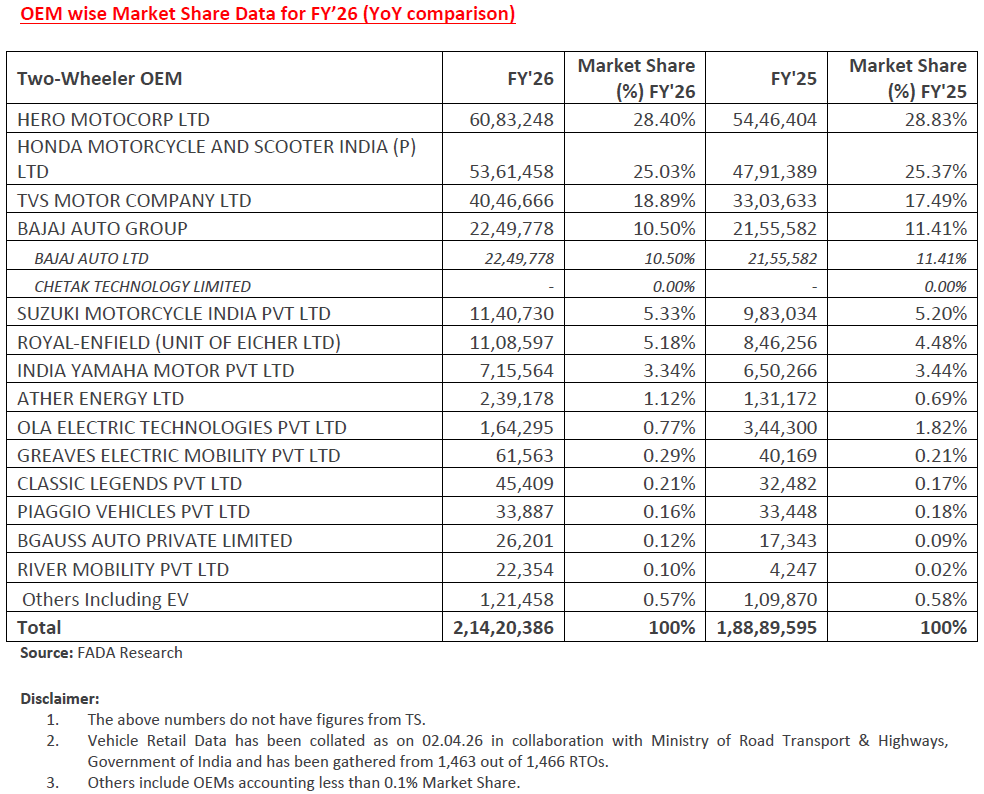
Table below captures OEM wise Market Share: 3 Wheelers
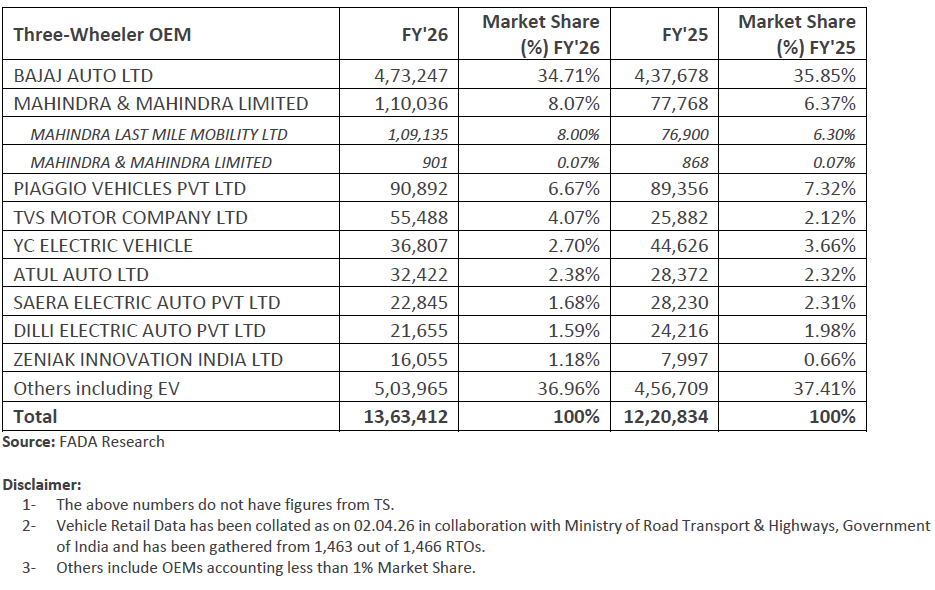
Table below captures OEM wise Market Share: Commercial Vehicles
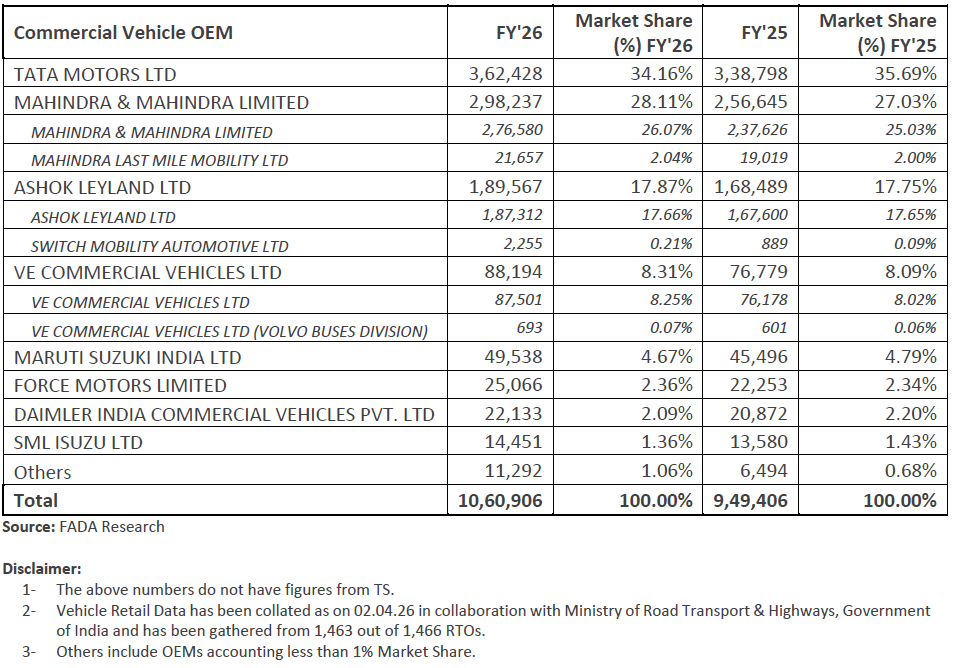
Table below captures OEM wise Market Share: Passenger Vehicles
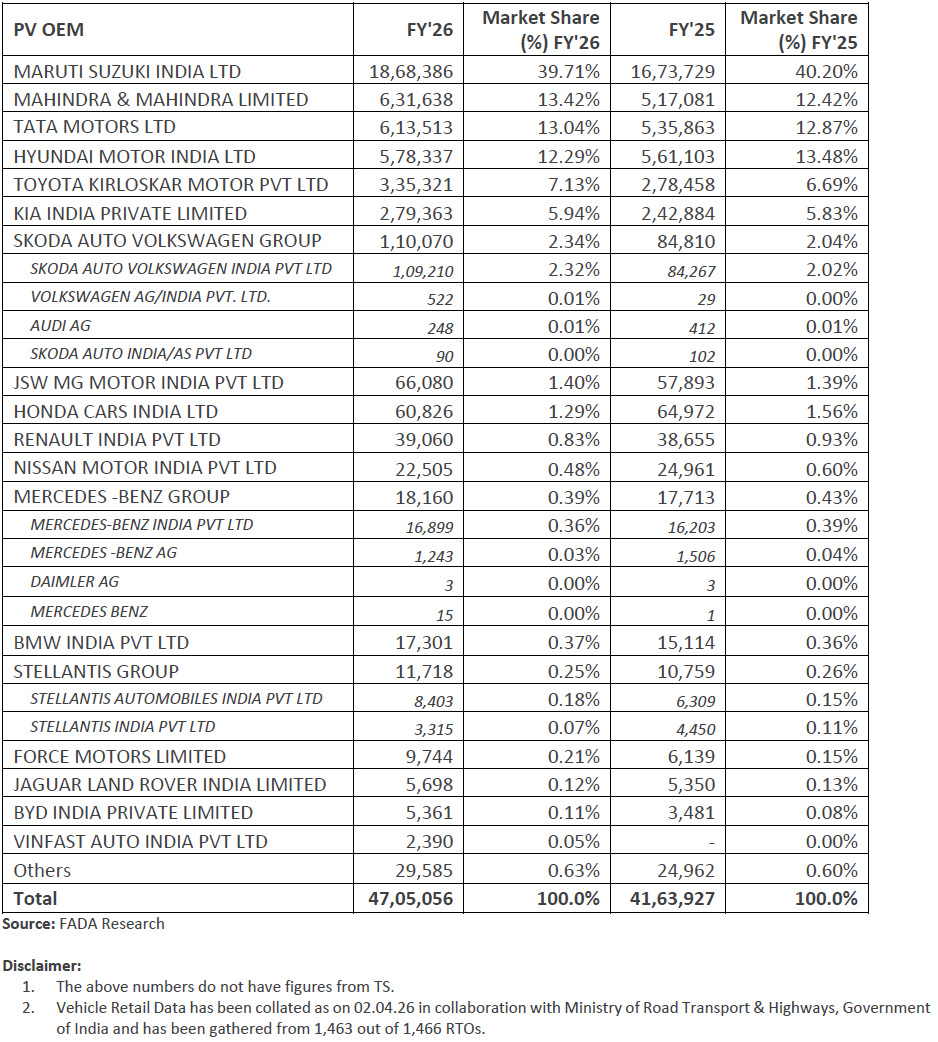
Table below captures OEM wise Market Share: Tractors
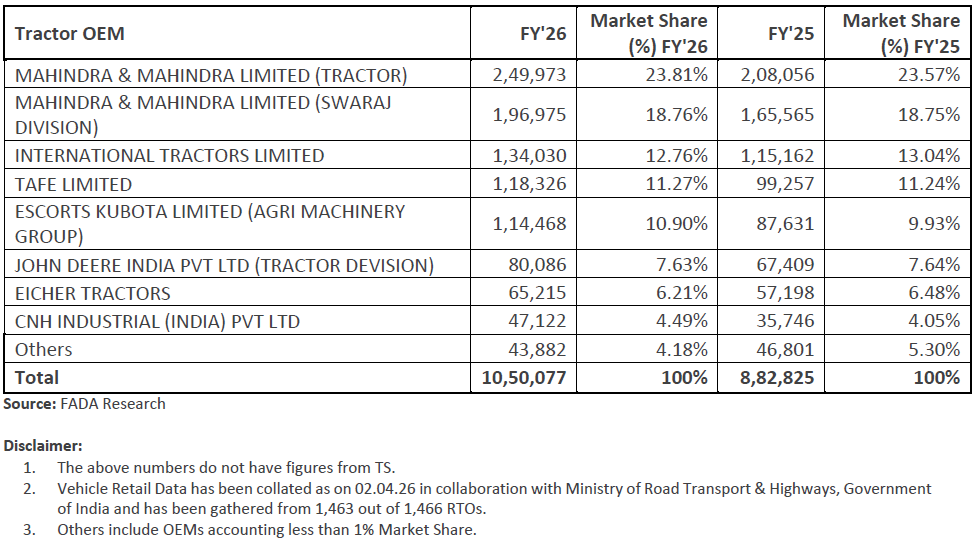
Table below captures OEM wise Market Share: Construction Equipment