Deep Dive: Wind CUF Statistical Analysis
This page presents a statistical deep dive into a representative wind capacity utilisation factor (CUF) profile. The analysis is based on a reduced-form 288-hour structure (12 months × 24 hours), constructed to illustrate seasonal and diurnal availability patterns.
The objective is to demonstrate analytical capability rather than produce forecasts. No user inputs are involved, and all results are deterministic.
Overall CUF Characteristics
| Metric | Value |
|---|---|
| Mean CUF (%) | 34.99 |
| Median CUF (%) | 31.54 |
| Min CUF (%) | 4.27 |
| Max CUF (%) | 87.66 |
| Std Dev (%) | 18.16 |
| Coeff of Variation | 0.52 |
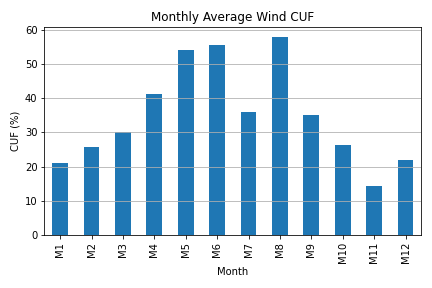
Month-wise CUF Statistics
| Period | Mean CUF (%) | Min CUF (%) | Max CUF (%) | Hourly Std Dev (%) |
|---|---|---|---|---|
| M1 | 21.07 | 7.58 | 31.3 | 7.65 |
| M2 | 25.76 | 11.43 | 38.4 | 9.16 |
| M3 | 30.21 | 14.58 | 53.07 | 12.89 |
| M4 | 41.16 | 21.19 | 77.84 | 16.88 |
| M5 | 54.08 | 37.41 | 87.66 | 16.39 |
| M6 | 55.74 | 32.91 | 83.77 | 16.06 |
| M7 | 36.1 | 18.12 | 49.89 | 8.51 |
| M8 | 58.07 | 34.58 | 79.96 | 14.77 |
| M9 | 35.24 | 25.59 | 57.22 | 9.43 |
| M10 | 26.36 | 16.62 | 44.2 | 8.76 |
| M11 | 14.23 | 4.27 | 25.22 | 6.81 |
| M12 | 21.85 | 6.28 | 32.77 | 7.7 |
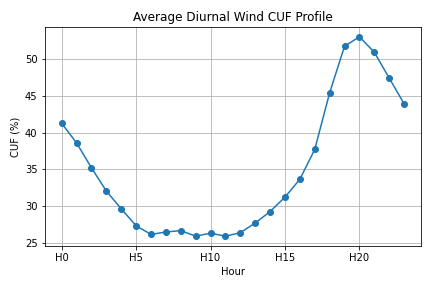
Hour-wise CUF Statistics
| Mean CUF (%) | Min CUF (%) | Max CUF (%) | Std Dev (%) | |
|---|---|---|---|---|
| H0 | 41.27 | 21.56 | 68.38 | 13.74 |
| H1 | 38.59 | 19.65 | 63.08 | 12.47 |
| H2 | 35.2 | 18.03 | 54.85 | 10.57 |
| H3 | 32.04 | 17.12 | 47.27 | 8.58 |
| H4 | 29.62 | 16.24 | 43.72 | 7.27 |
| H5 | 27.31 | 15.55 | 40.31 | 6.82 |
| H6 | 26.14 | 14.63 | 39.57 | 7.85 |
| H7 | 26.46 | 12.29 | 49.16 | 12.37 |
| H8 | 26.66 | 5.38 | 63.68 | 17.91 |
| H9 | 25.89 | 4.27 | 63.82 | 18.18 |
| H10 | 26.31 | 6.81 | 62.28 | 15.65 |
| H11 | 25.89 | 6.79 | 63.61 | 15.88 |
| H12 | 26.37 | 7.24 | 66.41 | 16.77 |
| H13 | 27.69 | 7.72 | 69.53 | 17.73 |
| H14 | 29.24 | 8.17 | 72.08 | 18.5 |
| H15 | 31.21 | 8.51 | 75.56 | 19.56 |
| H16 | 33.64 | 8.63 | 78.98 | 20.75 |
| H17 | 37.71 | 10.28 | 79.96 | 21.25 |
| H18 | 45.42 | 14.72 | 76.71 | 20.61 |
| H19 | 51.75 | 20.19 | 83.21 | 21.46 |
| H20 | 53.05 | 24.09 | 87.66 | 21.34 |
| H21 | 50.94 | 25.22 | 84.7 | 19.9 |
| H22 | 47.42 | 24.9 | 78.13 | 17.3 |
| H23 | 43.93 | 23.65 | 70.85 | 14.96 |
Intra-day CUF Variability Ratio (Max / Min)
| Period | Min CUF (%) | Max CUF (%) | Intra-day CUF Variability Ratio |
|---|---|---|---|
| M1 | 7.58 | 31.3 | 4.13 |
| M2 | 11.43 | 38.4 | 3.36 |
| M3 | 14.58 | 53.07 | 3.64 |
| M4 | 21.19 | 77.84 | 3.67 |
| M5 | 37.41 | 87.66 | 2.34 |
| M6 | 32.91 | 83.77 | 2.55 |
| M7 | 18.12 | 49.89 | 2.75 |
| M8 | 34.58 | 79.96 | 2.31 |
| M9 | 25.59 | 57.22 | 2.24 |
| M10 | 16.62 | 44.2 | 2.66 |
| M11 | 4.27 | 25.22 | 5.91 |
| M12 | 6.28 | 32.77 | 5.22 |
Key Visualisations
Average Diurnal Wind CUF Profile
Monthly Average Wind CUF
Our commercial modelling framework uses full 8760-hour wind CUF profiles to capture hour-by-hour variability across the year.