Coal Prices: Annual Average ($/tonne)
(Data Source: World Bank Commodity Markets section)
This section captures annual trend in Coal prices of Australian and South African Coal. In the Table:
Coal (Australia): from February 2022, port thermal, f.o.b. Newcastle, 6000 kcal/kg futures price. From 2015 to January 2022, port thermal, f.o.b. Newcastle, 6000 kcal/kg spot price. 2002-2014, thermal GAR, f.o.b. piers, Newcastle/Port Kembla , 6,300 kcal/kg (11,340 btu/lb), less than 0.8% sulfur, 13% ash; previously 6,667 kcal/kg (12,000 btu/lb), less than 1.0% sulfur, 14% ash
Coal (South Africa): from January 2015, f.o.b. Richards Bay, NAR, 6,000 kcal/kg, sulfur less than 1%, forward month 1; from February 13, 2017 to December 2017, thermal NAR netback assessment f.o.b. Richards Bay 6,000 kcal/kg; during 2006-February 10, 2017 thermal NAR; during 2002-2005 6,200 kcal/kg (11,200 btu/lb), less than 1.0%, sulfur 16% ash; years 1990-2001 6390 kcal/kg (11,500 btu/lb)
Readers will come across the terms GAR and NAR, as above. GAR (Gross As Received) and NAR (Net As Received) are two different ways of measuring the energy content of coal. GAR is the total heat energy in the coal as it is received, including the moisture content. NAR is the usable heat energy available after the moisture has been converted to vapor during combustion, so it is lower than GAR and represents the actual energy available for use
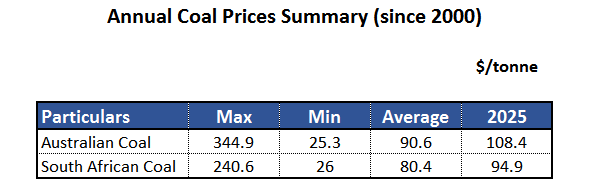
During 2025, the average price of Australian coal was $108.4/ tonne while that of South African Coal was $94.9/tonne
Along with Indonesia, Australia and South Africa are the largest exporters of coal to India and their prices are taken into consideration while working out the National Coal Index (NCI)
| Year | Australian Coal Price dollar per ton | South African Coal Price dollar per ton |
|---|---|---|
| 2025 | 108.4 | 94.9 |
| 2024 | 136.1 | 105.8 |
| 2023 | 172.8 | 119.1 |
| 2022 | 344.9 | 240.6 |
| 2021 | 138.1 | 119.8 |
| 2020 | 60.8 | 65.7 |
| 2019 | 77.9 | 71.9 |
| 2018 | 107.0 | 97.6 |
| 2017 | 88.5 | 85.1 |
| 2016 | 66.1 | 63.9 |
| 2015 | 58.9 | 56.7 |
| 2014 | 70.1 | 72.3 |
| 2013 | 84.6 | 80.2 |
| 2012 | 96.4 | 92.9 |
| 2011 | 121.4 | 116.3 |
| 2010 | 99.0 | 91.6 |
| 2009 | 71.8 | 64.7 |
| 2008 | 127.1 | 120.6 |
| 2007 | 65.7 | 62.7 |
| 2006 | 49.1 | 50.7 |
| 2005 | 47.6 | 46.2 |
| 2004 | 52.9 | 54.7 |
| 2003 | 26.1 | 30.2 |
| 2002 | 25.3 | 26.0 |
| 2001 | 32.3 | 33.9 |
| 2000 | 26.3 | 26.6 |
| 1999 | 25.9 | 24.3 |
| 1998 | 29.2 | 26.8 |
| 1997 | 35.1 | 31.3 |
| 1996 | 38.1 | 33.5 |
| 1995 | 39.4 | 35.2 |
| 1994 | 32.3 | 28.6 |
| 1993 | 31.3 | 27.0 |
| 1992 | 38.6 | 28.8 |
| 1991 | 39.7 | 31.5 |
| 1990 | 39.7 | 32.9 |
| 1989 | 38.0 | 31.0 |
| 1988 | 34.9 | 28.1 |
| 1987 | 27.5 | 26.5 |
| 1986 | 31.1 | 30.4 |
| 1985 | 33.8 | 34.9 |
| 1984 | 31.0 | 32.9 |
| 1983 | 38.2 | |
| 1982 | 54.8 | |
| 1981 | 53.6 | |
| 1980 | 40.1 | |
| 1979 | 30.9 | |
| 1978 | 29.1 | |
| 1977 | 28.7 | |
| 1976 | 27.2 | |
| 1975 | 26.8 | |
| 1974 | 16.9 | |
| 1973 | 11.5 | |
| 1972 | 9.6 | |
| 1971 | 8.7 | |
| 1970 | 7.8 |
View the trends graphically
Coal Prices Summary
Table below captures Maximum / Minimun / Average of coal prices since 2000, along with the latest prices