All Ports: Statewise Traffic
(Source: Basic Port Statistics)
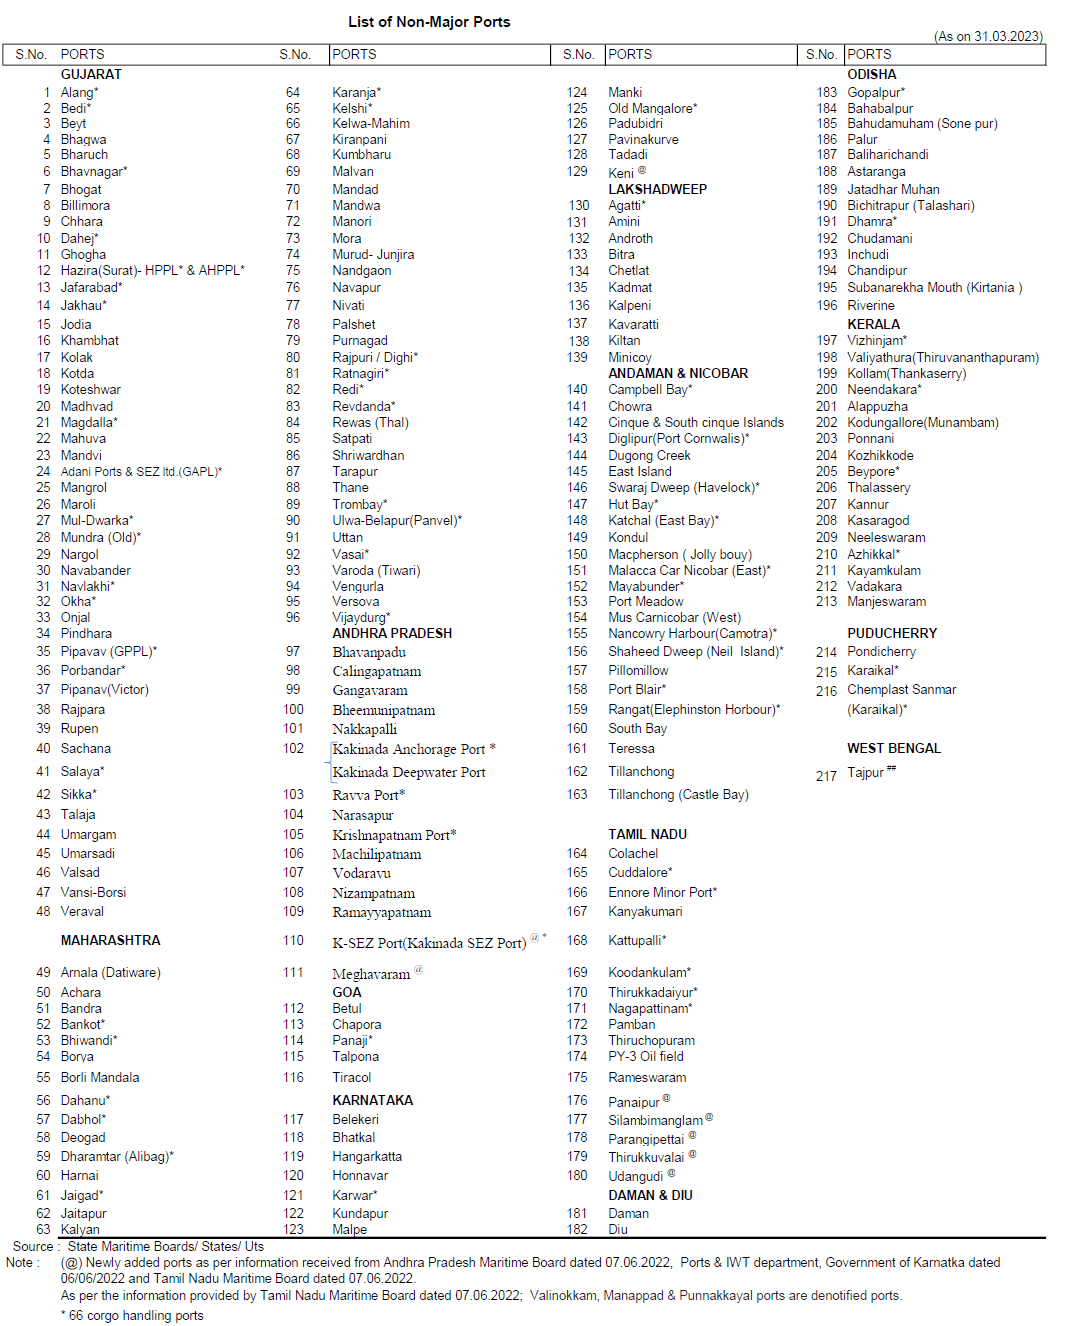
India has a coastline of over 7,517 Kms with 12 major ports and 217 notified non-major (minor/intermediate) ports along the coast-line and sea-islands
While the Major Ports are under the administrative control of Ministry of Shipping, the non-major ports are under the jurisdiction of respective State Maritime Boards/ State Government
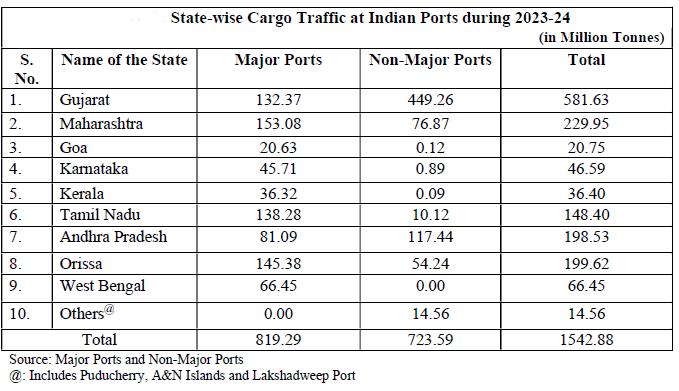
Table below captures trend in state-wise traffic handled at Major + Non-Major Ports. Our other sections cover trends in individual Major Port-wise traffic handled, and state-wise traffic handled at Non-Major Ports
For 2023-24, Gujarat 581.6 MMTPA (37.7%), Maharashtra 229.9 MMTPA (14.9%), Odisha 199.6 MMTPA (12.9%) were the top three states in terms of total traffic handled (Major + Non-Major Ports), followed by Andhra Pradesh 198.5 MMTPA (12.9%) and Tamil Nadu 148.4 MMTPA (9.6%)
The top three states accounted for 65.5% of total traffic handled
| Year | GUJARAT MMTPA | MAHARASHTRA MMTPA | GOA MMTPA | KARNATAKA MMTPA | KERALA MMTPA | TAMILNADU MMTPA | PONDICHERRY MMTPA | ANDHRA PRADESH MMTPA | ODISHA MMTPA | WEST BENGAL MMTPA | SEA ISLANDS MMTPA | ALL PORTS STATEWISE MMTPA | Share GUJARAT pct | Share MAHARASHTRA pct | Share GOA pct | Share KARNATAKA pct | Share KERALA pct | Share TAMILNADU pct | Share PONDICHERRY pct | Share ANDHRA PRADESH pct | Share ODISHA pct | Share WEST BENGAL pct | Share SEA ISLANDS pct | Total All Ports Statewise |
|---|---|---|---|---|---|---|---|---|---|---|---|---|---|---|---|---|---|---|---|---|---|---|---|---|
| 2023-24 | 581.6 | 229.9 | 20.7 | 46.6 | 36.4 | 148.4 | 12.3 | 198.5 | 199.6 | 66.4 | 2.3 | 1542.9 | 37.7 | 14.9 | 1.3 | 3.0 | 2.4 | 9.6 | 0.8 | 12.9 | 12.9 | 4.3 | 0.1 | 100.0 |
| 2022-23 | 553.9 | 218.7 | 17.3 | 42.5 | 35.4 | 140.4 | 10.1 | 175.2 | 174.1 | 65.7 | 2.1 | 1435.3 | 38.6 | 15.2 | 1.2 | 3.0 | 2.5 | 9.8 | 0.7 | 12.2 | 12.1 | 4.6 | 0.1 | 100.0 |
| 2021-22 | 532.5 | 188.4 | 18.5 | 40.1 | 34.7 | 129.3 | 5.8 | 157.0 | 157.7 | 58.2 | 1.7 | 1323.8 | 40.2 | 14.2 | 1.4 | 3.0 | 2.6 | 9.8 | 0.4 | 11.9 | 11.9 | 4.4 | 0.1 | 100.0 |
| 2020-21 | 505.1 | 158.0 | 22.0 | 37.3 | 31.6 | 108.6 | 7.3 | 159.5 | 157.6 | 61.4 | 1.5 | 1250.0 | 40.4 | 12.6 | 1.8 | 3.0 | 2.5 | 8.7 | 0.6 | 12.8 | 12.6 | 4.9 | 0.1 | 100.0 |
| 2019-20 | 534.4 | 172.8 | 16.0 | 40.1 | 34.2 | 126.0 | 10.1 | 172.6 | 148.0 | 64.0 | 1.9 | 1320.0 | 40.5 | 13.1 | 1.2 | 3.0 | 2.6 | 9.5 | 0.8 | 13.1 | 11.2 | 4.8 | 0.1 | 100.0 |
| 2018-19 | 514.6 | 177.1 | 17.7 | 43.6 | 32.2 | 122.8 | 8.4 | 168.6 | 131.5 | 63.8 | 1.5 | 1281.8 | 40.1 | 13.8 | 1.4 | 3.4 | 2.5 | 9.6 | 0.7 | 13.2 | 10.3 | 5.0 | 0.1 | 100.0 |
| 2017-18 | 480.9 | 166.8 | 27.0 | 42.7 | 29.3 | 120.0 | 8.1 | 149.8 | 124.6 | 57.9 | 1.4 | 1208.6 | 39.8 | 13.8 | 2.2 | 3.5 | 2.4 | 9.9 | 0.7 | 12.4 | 10.3 | 4.8 | 0.1 | 100.0 |
| 2016-17 | 451.2 | 160.2 | 33.3 | 40.6 | 25.1 | 119.8 | 9.1 | 130.6 | 111.4 | 51.0 | 1.3 | 1133.7 | 39.8 | 14.1 | 2.9 | 3.6 | 2.2 | 10.6 | 0.8 | 11.5 | 9.8 | 4.5 | 0.1 | 100.0 |
| 2015-16 | 439.2 | 154.0 | 21.2 | 36.4 | 22.2 | 120.0 | 6.0 | 129.8 | 91.3 | 50.3 | 1.3 | 1071.8 | 41.0 | 14.4 | 2.0 | 3.4 | 2.1 | 11.2 | 0.6 | 12.1 | 8.5 | 4.7 | 0.1 | 100.0 |
| 2014-15 | 428.6 | 152.8 | 15.5 | 37.2 | 21.8 | 116.0 | 5.0 | 141.4 | 86.5 | 46.3 | 1.3 | 1052.2 | 40.7 | 14.5 | 1.5 | 3.5 | 2.1 | 11.0 | 0.5 | 13.4 | 8.2 | 4.4 | 0.1 | 100.0 |
| 2013-14 | 397.0 | 146.2 | 12.0 | 39.9 | 21.0 | 108.0 | 6.3 | 117.2 | 82.4 | 41.4 | 1.3 | 972.5 | 40.8 | 15.0 | 1.2 | 4.1 | 2.2 | 11.1 | 0.6 | 12.1 | 8.5 | 4.3 | 0.1 | 100.0 |
| 2012-13 | 381.4 | 146.7 | 21.1 | 37.6 | 19.9 | 100.5 | 6.9 | 110.8 | 67.6 | 39.9 | 1.1 | 933.8 | 40.8 | 15.7 | 2.3 | 4.0 | 2.1 | 10.8 | 0.7 | 11.9 | 7.2 | 4.3 | 0.1 | 100.0 |
| 2011-12 | 341.6 | 141.9 | 53.5 | 33.5 | 20.2 | 100.0 | 6.4 | 113.1 | 59.3 | 43.2 | 1.2 | 913.9 | 37.4 | 15.5 | 5.9 | 3.7 | 2.2 | 10.9 | 0.7 | 12.4 | 6.5 | 4.7 | 0.1 | 100.0 |
| 2010-11 | 312.8 | 133.8 | 64.6 | 34.6 | 18.0 | 99.8 | 4.7 | 111.3 | 56.5 | 47.5 | 1.7 | 885.4 | 35.3 | 15.1 | 7.3 | 3.9 | 2.0 | 11.3 | 0.5 | 12.6 | 6.4 | 5.4 | 0.2 | 100.0 |
| 2009-10 | 285.1 | 127.4 | 62.7 | 44.1 | 17.5 | 96.7 | 1.3 | 109.2 | 57.5 | 46.4 | 2.1 | 850.0 | 33.5 | 15.0 | 7.4 | 5.2 | 2.1 | 11.4 | 0.2 | 12.8 | 6.8 | 5.5 | 0.2 | 100.0 |
| 2008-09 | 225.0 | 119.6 | 53.6 | 41.7 | 15.6 | 91.9 | 0.0 | 93.6 | 46.7 | 54.2 | 2.0 | 744.0 | 30.2 | 16.1 | 7.2 | 5.6 | 2.1 | 12.4 | 0.0 | 12.6 | 6.3 | 7.3 | 0.3 | 100.0 |
| 2007-08 | 215.4 | 124.2 | 48.0 | 44.9 | 15.9 | 91.1 | 0.0 | 83.9 | 42.7 | 57.3 | 2.2 | 725.7 | 29.7 | 17.1 | 6.6 | 6.2 | 2.2 | 12.6 | 0.0 | 11.6 | 5.9 | 7.9 | 0.3 | 100.0 |
| 2006-07 | 184.2 | 108.8 | 48.5 | 38.6 | 15.4 | 82.9 | 0.0 | 75.0 | 38.5 | 55.1 | 1.6 | 648.7 | 28.4 | 16.8 | 7.5 | 6.0 | 2.4 | 12.8 | 0.0 | 11.6 | 5.9 | 8.5 | 0.2 | 100.0 |
| 2005-06 | 149.4 | 93.2 | 43.5 | 38.6 | 14.0 | 74.3 | 0.1 | 73.5 | 33.1 | 53.1 | 0.9 | 573.7 | 26.0 | 16.2 | 7.6 | 6.7 | 2.4 | 12.9 | 0.0 | 12.8 | 5.8 | 9.3 | 0.2 | 100.0 |
| 2004-05 | 137.7 | 80.1 | 38.9 | 37.4 | 14.2 | 70.0 | 0.1 | 65.2 | 30.1 | 46.2 | 0.9 | 520.7 | 26.4 | 15.4 | 7.5 | 7.2 | 2.7 | 13.4 | 0.0 | 12.5 | 5.8 | 8.9 | 0.2 | 100.0 |
| 2003-04 | 128.9 | 71.5 | 36.3 | 27.8 | 13.6 | 60.4 | 0.1 | 57.8 | 25.3 | 41.3 | 0.7 | 463.7 | 27.8 | 15.4 | 7.8 | 6.0 | 2.9 | 13.0 | 0.0 | 12.5 | 5.5 | 8.9 | 0.2 | 100.0 |
| 2002-03 | 122.2 | 62.3 | 24.2 | 22.1 | 13.1 | 56.1 | 0.0 | 56.2 | 23.9 | 35.8 | 0.9 | 421.9 | 29.0 | 14.8 | 5.7 | 5.2 | 3.1 | 13.3 | 0.0 | 13.3 | 5.7 | 8.5 | 0.2 | 100.0 |
| 2001-02 | 117.3 | 53.9 | 25.8 | 18.2 | 12.2 | 53.1 | 0.1 | 50.0 | 21.1 | 30.4 | 1.0 | 383.1 | 30.6 | 14.1 | 6.7 | 4.8 | 3.2 | 13.9 | 0.0 | 13.1 | 5.5 | 7.9 | 0.3 | 100.0 |
| 2000-01 | 108.0 | 51.7 | 22.8 | 18.6 | 13.2 | 53.8 | 0.1 | 49.5 | 20.0 | 30.0 | 0.7 | 368.5 | 29.3 | 14.0 | 6.2 | 5.0 | 3.6 | 14.6 | 0.0 | 13.4 | 5.4 | 8.1 | 0.2 | 100.0 |
Table below captures snapshot of break up of Statewise Traffic into Major and Non-Major Ports
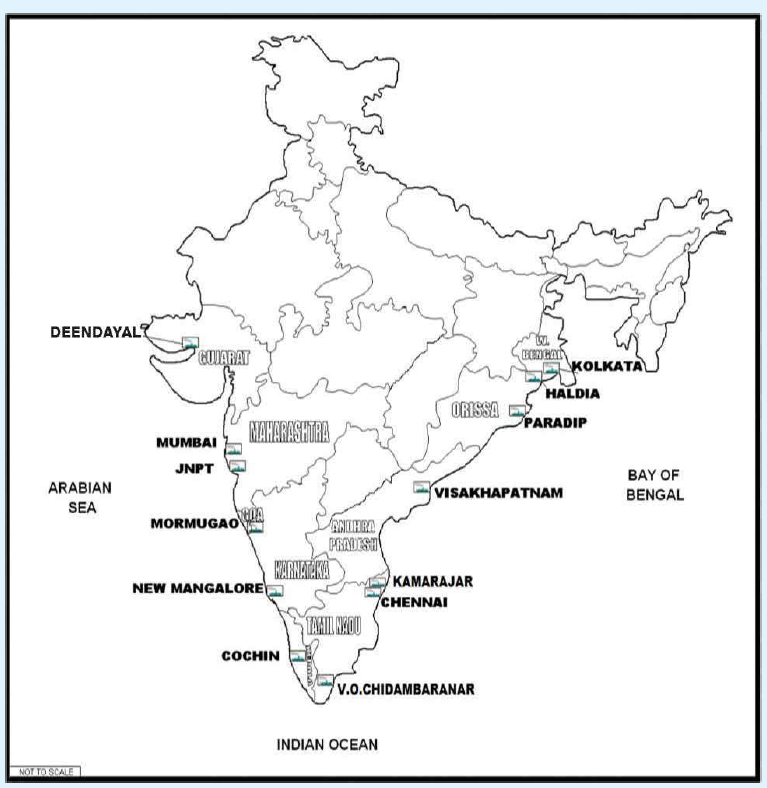
Major Ports:
Out of the 12 major ports, 6 are located on the East Coast and 6 on the West Coast
Non-Major Ports:
The 217 Non-major ports are located in Gujarat (48), Maharashtra (48), Goa (5), Daman & Diu (2), Karnataka (13), Kerala (17), Lakshadweep (10), Tamil Nadu (17), Puducherry (3), Andhra Pradesh (15), Odisha (14), West Bengal (1) and Andaman & Nicobar Island (24)
Out of these 217 Non-major ports, only some ports are well developed and provide all-weather berthing facilities for cargo handling. Only 66 Non-major Ports are cargo handling Ports