Coal Consumption
(Source: Ministry of Coal)
India`s coal consumption was 71 million tons during 1970-71. It crossed the 100 MMTPA mark in 1976-77, the 200 MMTPA mark in 1989-90 and the 300 MMTPA mark in 1997-98
At the turn of the current century, India`s coal consumption was 315 million tons. It crossed the 400 MMTPA mark in 2004-05, the 500 MMTPA mark in 2007-08, the 600 MMTPA mark in 2009-10, the 700 MMTPA mark in 2013-14 and the 800 MMTPA mark in the very next year (2014-15). This particular year thus saw a single-year consumption increase of over 100 million tons
The consumption crossed the 900 MMTPA mark in 2018-19 and the 1,000 MMTPA mark in 2019-20
Consumption fell for the next two years, due to the COVID impact, but has significantly increased thereafter
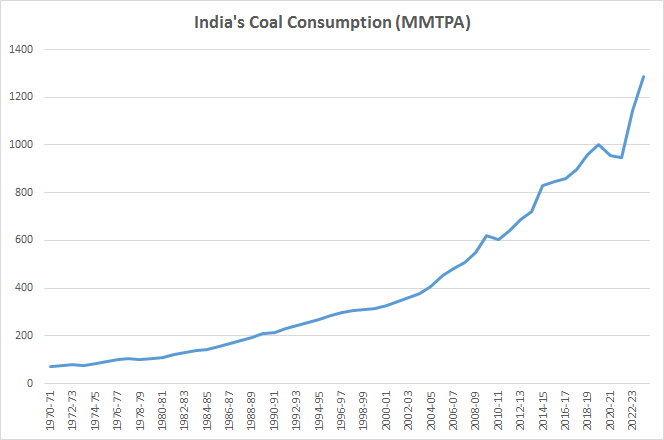
Table below captures trend in industry-wise coal consumption in India
During 2023-24, Electricity sector was the major consumer, accounting for 859.3 million tonnes (69.4%). Consumption in Steel & Washery was 76.2 million tonnes (6.2%), in Cement it was 9.2 million tonnes, in Sponge Iron it was 12 million tonnes, while certain other sectors like Paper, Textiles, Fertilisers and Bricks each had small coal consumption
| Year | Coal Consumption in Electricity | Steel & Washery + Import Coking Coal | Coal Consumption in Cement | Coal Consumption in Paper | Coal Consumption in Textile | Coal Consumption in Sponge Iron | Coal Consumption in Fertilizers & Chemicals | Coal Consumption in Bricks | Others+ Import Non-Coking Coal | Total Coal Consumption MMTPA | Share of Electricity pct | Share of Steel & Washery pct | Share of All Others | Total |
|---|---|---|---|---|---|---|---|---|---|---|---|---|---|---|
| 2023-24 | 859.3 | 76.2 | 9.2 | 1.0 | 0.2 | 12.0 | 0.8 | 0.1 | 279.0 | 1237.7 | 69.4 | 6.2 | 24.4 | 100.0 |
| 2022-23 | 785.4 | 69.4 | 9.3 | 1.3 | 0.1 | 8.1 | 0.9 | 0.1 | 240.7 | 1115.2 | 70.4 | 6.2 | 23.3 | 100.0 |
| 2021-22 | 710.0 | 66.3 | 7.3 | 1.2 | 0.1 | 9.0 | 1.3 | 0.0 | 232.7 | 1028.0 | 69.1 | 6.4 | 24.5 | 100.0 |
| 2020-21 | 581.2 | 60.2 | 6.8 | 1.0 | 0.1 | 9.6 | 1.5 | 0.0 | 245.9 | 906.3 | 64.1 | 6.6 | 29.2 | 100.0 |
| 2019-20 | 626.1 | 63.7 | 8.6 | 1.3 | 0.1 | 10.5 | 1.8 | 0.0 | 243.7 | 955.9 | 65.5 | 6.7 | 27.8 | 100.0 |
| 2018-19 | 621.6 | 64.7 | 8.8 | 1.6 | 0.2 | 12.1 | 1.8 | 0.1 | 257.4 | 968.4 | 64.2 | 6.7 | 29.1 | 100.0 |
| 2017-18 | 585.5 | 58.5 | 7.7 | 1.5 | 0.2 | 8.5 | 2.2 | 0.1 | 234.3 | 898.5 | 65.2 | 6.5 | 28.3 | 100.0 |
| 2016-17 | 535.0 | 52.0 | 6.4 | 1.2 | 0.2 | 5.6 | 2.4 | 0.1 | 234.3 | 837.2 | 63.9 | 6.2 | 29.9 | 100.0 |
| 2015-16 | 517.8 | 57.1 | 9.0 | 1.2 | 0.3 | 7.8 | 2.6 | 0.1 | 241.0 | 836.7 | 61.9 | 6.8 | 31.3 | 100.0 |
| 2014-15 | 497.7 | 56.2 | 11.4 | 1.6 | 0.4 | 17.8 | 2.7 | 0.1 | 234.2 | 822.1 | 60.5 | 6.8 | 32.6 | 100.0 |
| 2013-14 | 449.0 | 53.0 | 11.9 | 1.9 | 0.4 | 18.5 | 2.6 | 4.0 | 198.0 | 739.3 | 60.7 | 7.2 | 32.1 | 100.0 |
| 2012-13 | 446.8 | 51.7 | 13.1 | 2.1 | 0.3 | 20.9 | 2.9 | 2.0 | 173.6 | 713.4 | 62.6 | 7.2 | 30.1 | 100.0 |
| 2011-12 | 410.4 | 47.9 | 13.2 | 2.0 | 0.3 | 21.7 | 3.2 | 0.1 | 140.0 | 638.7 | 64.2 | 7.5 | 28.3 | 100.0 |
Coal accounts for ~55-60% of India's primary energy consumption while it accounts for ~75% of India's electricity generation
Our various indicators in Primary Energy section, Primary Energy in India capture production and consumption of various energy sources, including coal, in their respective Physical Units as well as in Common Energy Unit of Peta Joules (PJ)