Electricity Installed Capacity: Non Utilities
(Source: CEA)
Power intensive Industries such as Aluminium, Cement, Chemicals, Fertilizers, Iron & Steel, Paper, Oil Refining and Sugar etc. have set up their own captive power plants, either to supplement the electricity purchased from the Utilities, or even more importantly, to entirely protect themselves from grid power and have certainty of electricity supply fully under own control
Electricity is also produced as a by-product of certain industrial processes
The captive power plants of industries have been allowed to sell their surplus power to the Grid under certain conditions
Captive Plants are also referred to as Non-Utilities
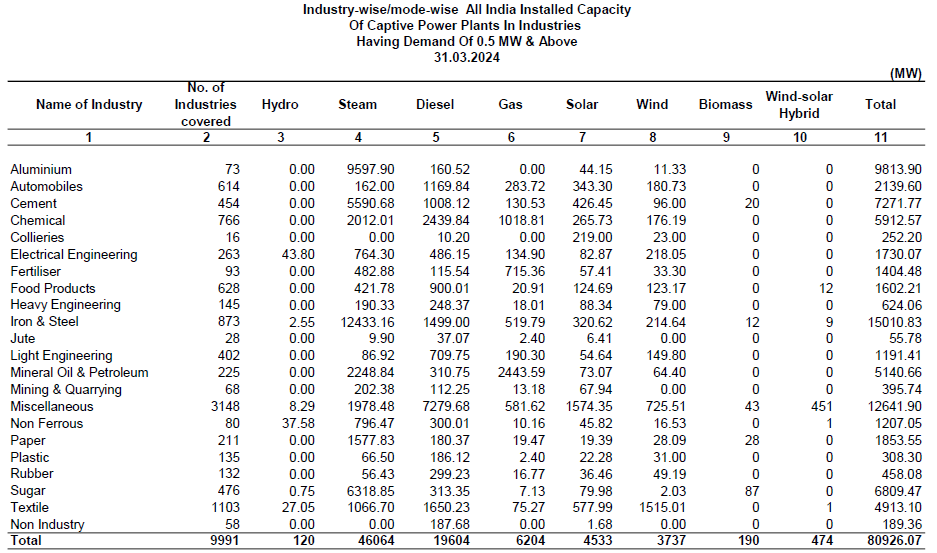
Central Electricity Authority (CEA) collects information from the industries with demand of 0.5 MW and above having their own captive power plants
For 2023-24, the total installed capacity of Non-Utilities was 80,926 MW, comprising 46,064 MW Coal based, 19,604 MW Diesel based, 6,204 MW Gas based, or a total thermal based capacity of 71,872 MW. Large-hydro based No-Utilities capacity was 120 MW while Non-Hydro Renewable was 8,934 MW
| Year | Coal | Diesel | Gas | Total Thermal | Large Hydro | Non Hydro Renewable | Total by Non Utilities |
|---|---|---|---|---|---|---|---|
| 2023-24 | 46064.3 | 19604.0 | 6204.0 | 71872.0 | 120.0 | 8934.0 | 80926.1 |
| 2022-23 | 46782.2 | 18077.8 | 6360.3 | 71220.3 | 132.3 | 7047.3 | 78399.8 |
| 2021-22 | 45302.7 | 18648.8 | 5685.3 | 69636.8 | 134.6 | 6961.1 | 76732.4 |
| 2020-21 | 47759.5 | 17562.9 | 7361.1 | 72683.5 | 130.7 | 5693.8 | 78508.0 |
| 2019-20 | 51542.8 | 12774.7 | 7315.9 | 71633.3 | 130.8 | 4475.3 | 76239.4 |
| 2018-19 | 47679.0 | 15571.0 | 8787.1 | 72037.1 | 103.4 | 3066.6 | 75207.1 |
| 2017-18 | 32854.4 | 13144.6 | 7156.4 | 53155.4 | 51.0 | 1726.2 | 54932.5 |
| 2016-17 | 30571.9 | 13349.7 | 6109.2 | 50030.8 | 65.3 | 1433.1 | 51529.2 |
| 2015-16 | 28687.6 | 12346.6 | 5818.6 | 46852.8 | 59.1 | 1367.6 | 48279.5 |
| 2014-15 | 26088.6 | 12008.9 | 5193.4 | 43290.9 | 65.1 | 1300.8 | 44656.8 |
| 2013-14 | 24751.6 | 11432.4 | 4751.4 | 40935.3 | 63.6 | 1259.0 | 42257.9 |
| 2012-13 | 23889.6 | 11148.1 | 4497.7 | 39535.4 | 66.9 | 1124.1 | 40726.4 |
| 2011-12 | 22615.4 | 9955.2 | 5885.0 | 38455.6 | 47.6 | 872.2 | 39375.4 |
| 2010-11 | 19111.5 | 9655.3 | 5053.8 | 33820.6 | 56.9 | 566.7 | 34444.1 |
| 2009-10 | 17183.3 | 9456.6 | 4368.0 | 31008.0 | 55.0 | 453.9 | 31516.9 |
Table below captures Industry-wise/mode-wise break up of Installed Capacity Of Captive Power Plants for 2023-24, totaling 80,926 MW