Electricity Installed Capacity: Utilities
(Source: CEA)
In India's electricity sector, utilities are the public or private entities responsible for the public supply of power, while non-utilities are industrial consumers that generate their own electricity for their own use
Utilities include companies engaged in generation, transmission, and distribution for public consumption, and their generation capacity and consumption is tracked as a separate category from industrial self-generation. Non-utility generation is significant, particularly in the industrial sector
The sources of electricity generation in India are broadly classified into conventional and non-conventional. The conventional sources of power generation are thermal (coal, lignite, natural gas, and oil), hydro and nuclear power, whereas nonconventional sources of power generation (renewable energy sources) include solar, wind, agricultural and domestic waste
Table below captures trend in fuel-wise installed capacities of Utilities
For 2024-25, total electricity installed capacity of Utilities was 475.2 GW, comprising 221.8 GW of Coal, 0.6 GW of Diesel, 24.5 GW of Natural Gas, for a total thermal capacity of 246.9 GW. Hydro was 47.7 GW, Nuclear was 8.2 GW and Non-Hydro Renewable was 172.4 GW
| Year | Coal GW | Diesel GW | Gas GW | Total Thermal GW | Hydro GW | Nuclear GW | Non Hydro Renewable GW | Total by Utilities GW |
|---|---|---|---|---|---|---|---|---|
| 2024-25 | 221.8 | 0.6 | 24.5 | 246.9 | 47.7 | 8.2 | 172.4 | 475.2 |
| 2023-24 | 217.6 | 0.6 | 25.0 | 243.2 | 46.9 | 8.2 | 143.6 | 442.0 |
| 2022-23 | 211.9 | 0.6 | 24.8 | 237.3 | 46.9 | 6.8 | 125.2 | 416.1 |
| 2021-22 | 210.7 | 0.5 | 24.9 | 236.1 | 46.7 | 6.8 | 109.9 | 399.5 |
| 2020-21 | 209.3 | 0.5 | 24.9 | 234.7 | 46.2 | 6.8 | 94.4 | 382.2 |
| 2019-20 | 205.1 | 0.5 | 25.0 | 230.6 | 45.7 | 6.8 | 87.0 | 370.1 |
| 2018-19 | 200.7 | 0.6 | 24.9 | 226.3 | 45.4 | 6.8 | 77.6 | 356.1 |
| 2017-18 | 197.2 | 0.8 | 24.9 | 222.9 | 45.3 | 6.8 | 69.0 | 344.0 |
| 2016-17 | 192.2 | 0.8 | 25.3 | 218.3 | 44.5 | 6.8 | 57.2 | 326.8 |
| 2015-16 | 185.2 | 1.0 | 24.5 | 210.7 | 42.8 | 5.8 | 45.9 | 305.2 |
| 2014-15 | 164.6 | 1.2 | 23.1 | 188.9 | 41.3 | 5.8 | 39.0 | 274.9 |
| 2013-14 | 145.3 | 1.2 | 21.8 | 168.3 | 40.5 | 4.8 | 35.0 | 248.6 |
| 2012-13 | 130.2 | 1.2 | 20.1 | 151.5 | 39.5 | 4.8 | 27.5 | 223.3 |
| 2011-12 | 112.0 | 1.2 | 18.4 | 131.6 | 39.0 | 4.8 | 24.5 | 199.9 |
| 2010-11 | 93.9 | 1.2 | 17.7 | 112.8 | 37.6 | 4.8 | 18.5 | 173.6 |
| 2009-10 | 84.2 | 1.2 | 17.1 | 102.5 | 36.9 | 4.6 | 15.5 | 159.4 |
| 2008-09 | 77.6 | 1.2 | 14.9 | 93.7 | 36.9 | 4.1 | 13.2 | 148.0 |
| 2007-08 | 76.0 | 1.2 | 14.7 | 91.9 | 35.9 | 4.1 | 11.1 | 143.1 |
| 2006-07 | 71.1 | 1.2 | 13.7 | 86.0 | 34.7 | 3.9 | 7.8 | 132.3 |
| 2005-06 | 68.5 | 1.2 | 12.7 | 82.4 | 32.3 | 3.4 | 6.2 | 124.3 |
| 2004-05 | 67.8 | 1.2 | 11.9 | 80.9 | 30.9 | 2.8 | 3.8 | 118.4 |
| 2003-04 | 65.0 | 1.2 | 11.8 | 78.0 | 29.5 | 2.7 | 2.5 | 112.7 |
| 2002-03 | 64.0 | 1.2 | 11.6 | 76.8 | 26.8 | 2.7 | 1.6 | 107.9 |
| 2001-02 | 62.1 | 1.2 | 11.2 | 74.5 | 26.3 | 2.7 | 1.6 | 105.0 |
| 2000-01 | 61.0 | 1.2 | 10.5 | 72.7 | 25.2 | 2.9 | 0.9 | 101.6 |
The month of September 2025 saw India reaching the milestone of 500 GW of installed capacity
Table below captures break up of this installed capacity
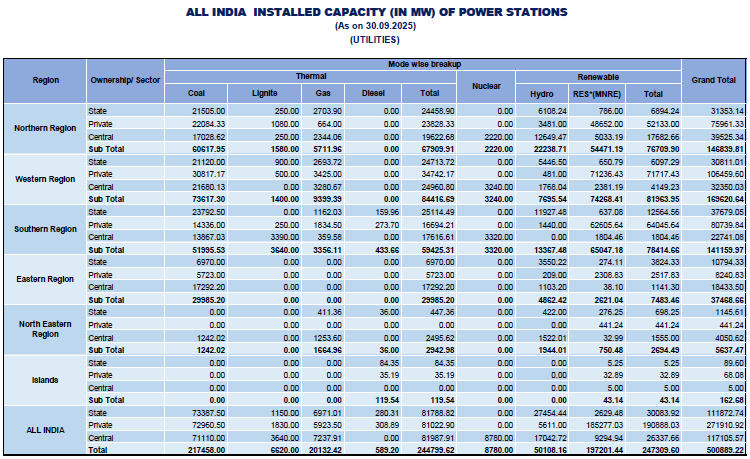
Table below captures break up of Renewable Energy Sources (RES) Capacity of 197.2 GW in this total installed capacity of 500 GW

RES comprised 5.13 GW of Small Hydro, 53.12 GW of Wind, 10.76 GW of Bio-power (biomass / cogen) and 127.33 GW Solar (Includes Ground Mounted Solar, Rooftop Solar, Hybrid Solar Component and Off-grid Solar/ KUSUM
View the trends graphically