Energy Sector Emissions
As per India's BUR-4, in 2020, India’s total GHG emissions excluding LULUCF amounted to 2,959 million tonnes CO2e and including LULUCF amounted to 2,437 million tonnes CO2e. The main contributors to the total GHG emission are CO2 emissions generated from burning fossil fuels, methane emissions from livestock and increasing aluminium and cement production. The LULUCF sector remained net sink during the inventory period 2020
The energy sector contributed the most to the overall emissions with 75.66 per cent, followed by agriculture sector 13.72 per cent, Industrial Processes and Product Use (IPPU) 8.06 per cent and Waste 2.56 per cent
The Energy sector, encompassing fossil fuel consumption and associated fugitive emissions, is the primary source of greenhouse gas emissions, accounting for 2,238.4 million tonnes CO2e
During the year 2020 the emissions at sub-sectoral level within the energy sector were Energy Industries (1,265.3), Manufacturing and Construction (390.7), Transport (297.4), and Other sectors (258.1), for total emissions from Fuel Combustion of 2,211.5 million tonnes CO2e
Adding Fugitive Emissions of 26.9 million tonnes CO2e, Total Energy Sector Emissions were 2,238.4 million tonnes CO2e
| Year | Energy Industries MMTPA CO2e | Manufacturing and Construction MMTPA CO2e | Transport MMTPA CO2e | Other sectors MMTPA CO2e | Sub Total Fuel Combustion MMTPA CO2e | Fugitive Emissions MMTPA CO2e | Total Energy Sector Emissions MMTPA CO2e |
|---|---|---|---|---|---|---|---|
| 2020 | 1265.3 | 390.7 | 297.4 | 258.1 | 2211.5 | 26.9 | 2238.4 |
| 2019 | 1331.9 | 404.7 | 314.8 | 287.0 | 2338.4 | 35.9 | 2374.3 |
| 2018 | 1324.2 | 412.1 | 307.3 | 264.2 | 2307.8 | 36.6 | 2344.3 |
| 2017 | 1255.7 | 393.3 | 290.7 | 228.9 | 2168.7 | 35.6 | 2204.3 |
| 2016 | 1206.6 | 397.7 | 274.4 | 213.5 | 2092.3 | 37.2 | 2129.4 |
| 2015 | 1197.1 | 394.1 | 261.5 | 202.3 | 2055.0 | 37.1 | 2092.1 |
| 2014 | 1141.0 | 351.9 | 250.2 | 128.6 | 1871.7 | 38.1 | 1909.8 |
| 2013 | 1054.0 | 356.8 | 241.3 | 122.8 | 1774.8 | 38.8 | 1813.6 |
| 2012 | 1005.8 | 343.6 | 236.0 | 119.2 | 1704.6 | 43.0 | 1747.7 |
| 2011 | 924.3 | 338.8 | 221.2 | 120.2 | 1604.5 | 47.4 | 1651.9 |
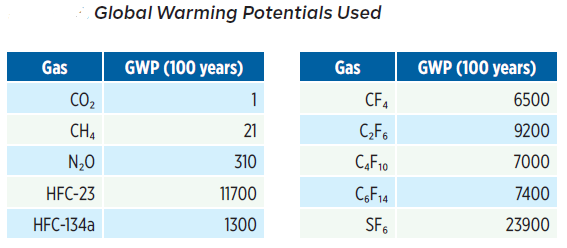
A Global Warming Potential (GWP) quantifies the globally averaged relative radiative forcing of a specific greenhouse gas. It is characterized as the total radiative forcing over a designated timeframe resulting from the emission of 1 kilogram (kg) of the gas, in comparison to that of the reference gas CO2. Direct radiative effects arise when the gas absorbs radiation directly. Indirect radiative forcing arises from chemical transformations of the original gas that yield greenhouse gases or when a gas affects other processes critical to radiative balance, such as the atmospheric lifetimes of different gases
All calculations in India's Fourth Biennial Update Report to the United Nations Framework Convention, utilize the Global Warming Potential (GWP) of greenhouse gases (GHGs) over a 100-year period, as per IPCC AR2, and are as captured in Table below: