Gross Generation Non Utilities
(Source: CEA)
CEA presents trend in Gross Generation, split into Utilities and Non-Utilities
Utilities are organizations involved in power generation, transmission, and distribution, while non-utilities generally refer to the captive power plants that produce power for their own use
This section captures fuel-wise gross generation from Non-Utilities
For 2023-24, total gross generation of Non-Utilities was 223,902 GWh (Giga Watt Hours), or ~223.9 TWh (Tera Watt Hours, which is same as Billion Units)
For ease of reference, GWh is same as Million Units (MU) and TWh is same as Billion Units (BU)
Coal accounted for 183,093 GWh (~183 TWh), Diesel 10,158 GWh (~10.16 TWh) and Gas 21,677 GWh (~21.7 TWh), for total thermal gross generation of 214,928 GWh (~214.9 TWh)
Hydro accounted for 274 GWh and Non-Hydro Renewables 8701 GWh (~8.7 TWh)
| Year | Coal based GWh | Diesel based GWh | Gas based GWh | Total Thermal based GWh | Hydro based GWh | Non Hydro Renewable based GWh | Total Gross Generation Non Utilities GWh |
|---|---|---|---|---|---|---|---|
| 2024-25 | 186900.0 | 12010.0 | 23008.0 | 221918.0 | 380.0 | 12800.0 | 235098.0 |
| 2023-24 | 183093.3 | 10157.7 | 21677.3 | 214928.3 | 273.6 | 8700.8 | 223902.7 |
| 2022-23 | 179831.2 | 2035.4 | 21086.6 | 202953.2 | 290.7 | 8687.9 | 211931.8 |
| 2021-22 | 179235.4 | 2104.5 | 20801.2 | 202141.1 | 356.7 | 6813.0 | 209310.8 |
| 2020-21 | 193142.6 | 2504.2 | 21683.5 | 217330.3 | 339.1 | 7157.9 | 224827.4 |
| 2019-20 | 205545.8 | 1919.3 | 25443.1 | 232908.2 | 348.0 | 6310.5 | 239566.8 |
| 2018-19 | 184250.4 | 5334.3 | 19545.1 | 209129.8 | 270.0 | 3673.9 | 213073.7 |
| 2017-18 | 143867.7 | 8106.9 | 25362.2 | 177336.7 | 112.5 | 2328.2 | 179777.4 |
| 2016-17 | 137588.3 | 9181.7 | 22855.3 | 169625.4 | 143.6 | 2277.0 | 172046.0 |
| 2015-16 | 136720.5 | 8412.2 | 21083.3 | 166216.0 | 110.1 | 2046.1 | 168372.2 |
| 2014-15 | 128401.1 | 9719.6 | 21135.2 | 159255.9 | 144.7 | 2656.4 | 162057.0 |
| 2013-14 | 118178.4 | 8866.5 | 19911.6 | 146956.5 | 129.1 | 1902.6 | 148988.2 |
| 2012-13 | 113167.0 | 8205.2 | 20768.9 | 142141.1 | 118.2 | 1750.4 | 144009.7 |
| 2011-12 | 104862.7 | 6244.3 | 21971.6 | 133078.5 | 131.3 | 1178.2 | 134388.0 |
| 2010-11 | 96657.1 | 7753.5 | 15435.2 | 119845.8 | 148.8 | 922.3 | 120916.9 |
| 2009-10 | 77416.3 | 8217.2 | 19738.7 | 105372.3 | 151.8 | 609.1 | 106133.1 |
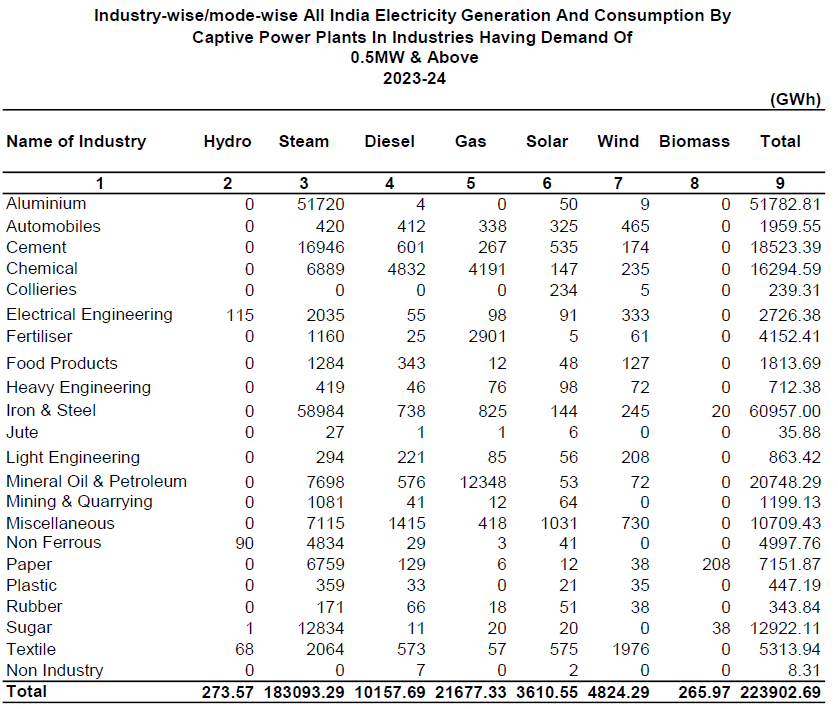
Table below captures Industry-wise/mode-wise break up of All India Electricity Generation of 223,903 GWh (~223.9 TWh) by Captive Power Plants In Industries Having Demand Of 0.5MW & Above for 2023-24