Gross Generation Utilities
(Source: CEA)
CEA presents trend in Gross Generation, split into Utilities and Non-Utilities
Utilities are organizations involved in power generation, transmission, and distribution, while non-utilities generally refer to the captive power plants that produce power for their own use
This section captures fuel-wise gross generation from Utilities
For 2023-24, total gross generation of Utilities was 1,734,375.1 GWh (Giga Watt Hours), or ~1,734 TWh (Tera Watt Hours, which is same as Billion Units)
For ease of reference, GWh is same as Million Units (MU) and TWh is same as Billion Units (BU)
Coal accounted for 1,294,852.4 GWh (~1,295 TWh), Diesel 400.6 GWh and Gas 31,295.9 GWh (~31 TWh), for total thermal gross generation of 1,326,548.9 GWh (~1,327 TWh)
Hydro accounted for 134,053.9 GWh (~134 TWh), Nuclear 47,937.4 GWh (~48 Twh) and Non-Hydro Renewables 225,834.8 GWh (~226 TWh)
| Year | Coal based GWh | Diesel based GWh | Gas based GWh | Total Thermal based GWh | Hydro based GWh | Nuclear based GWh | Non Hydro Renewable based GWh | Total Gross Generation Utilities GWh |
|---|---|---|---|---|---|---|---|---|
| 2024-25 | 1331867.0 | 443.0 | 31580.0 | 1363890.0 | 148634.0 | 56681.0 | 255009.0 | 1824214.0 |
| 2023-24 | 1294852.4 | 400.6 | 31295.9 | 1326548.9 | 134053.9 | 47937.4 | 225834.8 | 1734375.1 |
| 2022-23 | 1182095.8 | 409.0 | 23885.0 | 1206389.9 | 162098.8 | 45861.1 | 203554.6 | 1617904.3 |
| 2021-22 | 1078581.4 | 214.0 | 36015.8 | 1114811.2 | 151627.3 | 47112.1 | 170912.3 | 1484462.9 |
| 2020-21 | 981443.2 | 223.5 | 50944.0 | 1032610.8 | 150299.5 | 43029.1 | 147247.5 | 1373186.9 |
| 2019-20 | 994197.0 | 198.5 | 48442.6 | 1042838.2 | 155769.1 | 46472.5 | 138337.0 | 1383416.7 |
| 2018-19 | 1022265.3 | 215.1 | 49833.7 | 1072314.2 | 134893.6 | 37812.6 | 126759.1 | 1371779.5 |
| 2017-18 | 986590.7 | 348.0 | 50207.7 | 1037146.4 | 126122.7 | 38346.1 | 101839.5 | 1303454.7 |
| 2016-17 | 944021.8 | 400.6 | 49094.0 | 993516.3 | 122377.6 | 37915.9 | 81548.2 | 1235358.0 |
| 2015-16 | 895339.8 | 551.0 | 47122.1 | 943012.9 | 121376.7 | 37413.6 | 65780.8 | 1167584.0 |
| 2014-15 | 835290.8 | 1575.7 | 41075.1 | 877941.5 | 129243.7 | 36101.5 | 73563.2 | 1116849.9 |
| 2013-14 | 745533.1 | 1998.3 | 44522.2 | 792053.6 | 134847.5 | 34227.8 | 65519.7 | 1026648.6 |
| 2012-13 | 691341.2 | 2448.4 | 66663.9 | 760453.6 | 113720.3 | 32866.1 | 57448.9 | 964488.9 |
| 2011-12 | 612497.1 | 2648.7 | 93281.3 | 708427.1 | 130511.5 | 32286.6 | 51226.1 | 922451.2 |
| 2010-11 | 561298.1 | 3181.3 | 100342.4 | 664821.7 | 114415.5 | 26266.4 | 39244.5 | 844748.2 |
| 2009-10 | 539586.4 | 4248.3 | 96373.1 | 640207.8 | 104059.4 | 18636.4 | 36947.0 | 799850.6 |
View the trends graphically
Organizational Structure of Electricity Supply Industry in India
Formation of State Electricity Boards in various parts of the country started in the early 1950s to bring about systematic growth of power supply industry all over the country
In the year 1996-97, there were 18(eighteen) State Electricity Boards and 37(thirty-seven) State/ Central/ UTs owned undertakings/ corporations/ electricity departments dealing in generation/ transmission/distribution of electricity.
The process of unbundling of SEBs first started in Odisha with the formation of GRIDCO & OHPC Ltd. in the year 1996-97. With the promulgation of the Electricity Act 2003, all the SEBs have been unbundled.
As on 31st March 2024, there were one hundred fifty-one (151) Companies, Power Corporations, Management Boards under Central, State or Joint partnership existing in the country which are engaged in Generation, Transmission and Distribution apart from eleven (11) Electricity Departments in the States and Union Territories
As on 31.03.2024, there were fifty-nine (59) Power Trading Companies and one hundred fifty-seven (157) private licensees including Electric Supply Co-operative Societies existing
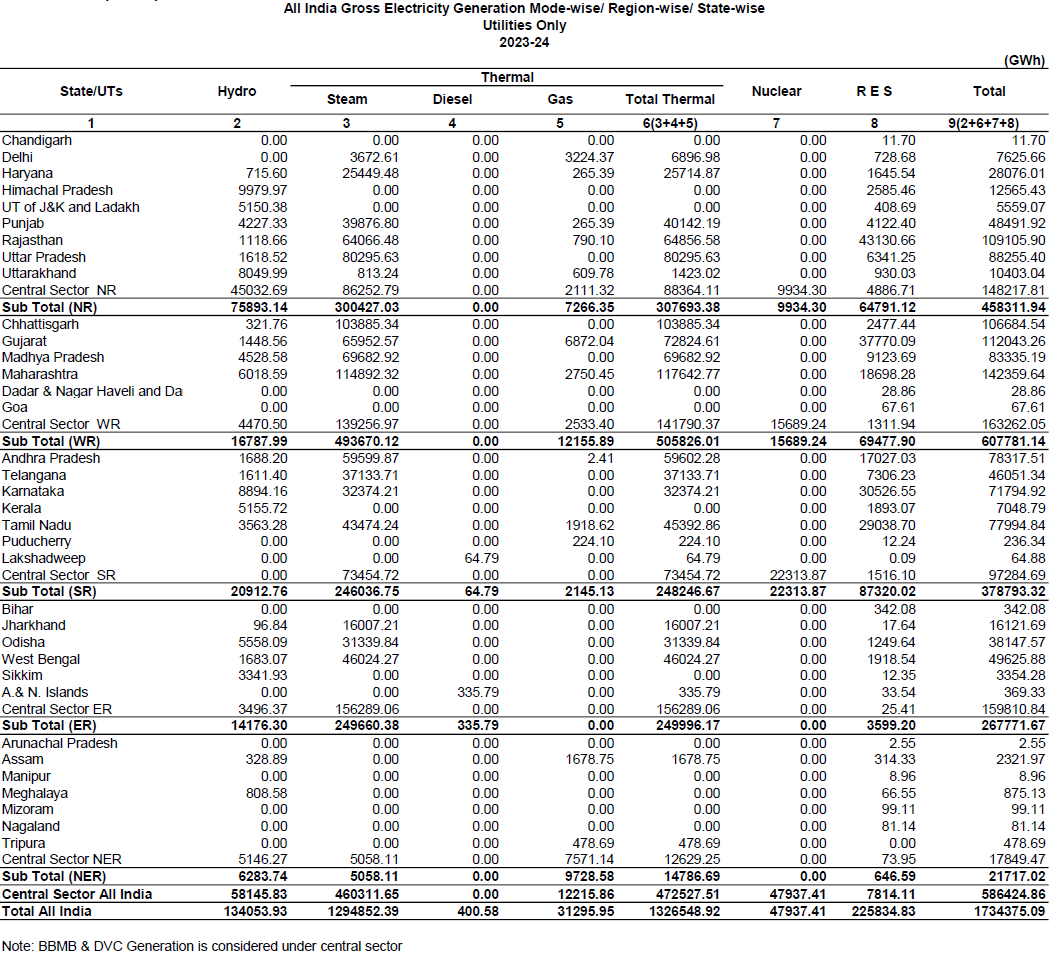
Mode-wise/ Region-wise/ State-wise Gross Generation (Utilities Only)
Table below captures All India Gross Electricity Generation Mode-wise/ Region-wise/ State-wise (Utilities only for 2023-24