IIP Use Based Annual
The Use Based Categories have been reframed in the new series based on recommendations of the Working Group and a Task Group constituted for the purpose in MoSPI
They comprise:
- Primary goods: Only such goods which are directly obtained from natural sources and used for further processing and consumption in manufacturing and power-generating activities. This category has been created to replace the existing category “Basic goods” since the latter suffered from definitional ambiguity and overlapping coverage with other categories such as “Intermediate goods”. E.g.: Ores and Minerals (incl. concentrates); Fuels (Diesel, Aviation Turbine Fuel, Kerosene, LPG, etc.) and Electricity
- Capital goods: Plants, machinery and goods used for further investments. E.g.: Boilers, Air & Gas Compressors, Engines including Internal Combustion and Diesel Engine, Tractors (complete), Transformers, Commercial Vehicles and all machineries like Textile Machinery, Printing Machinery etc.
- Infrastructure / construction goods: Finished goods which are primarily used in infrastructure industry or construction industry as an input. This category has been created to precisely categorise items which could not be classified under Consumer durables or Intermediate goods. E.g.: paints, cement, cables, bricks and tiles, rail materials, etc.
- Intermediate goods: Any good/ product produced as incomplete product or which goes as input in production for further finishing or forming a part of a product. E.g.: Cotton yarn, Plywood, Steel Tubes/ Pipes, Fasteners, etc.
- Consumer durables: Products directly used by consumers and having a longer durability (more than 2/3 years). E.g.: Pressure Cooker, Air Conditioners, Tyres, Telephone and mobile instruments, TV Sets, Passenger cars, Two-wheelers (motorcycles/ scooters), Jewellery of gold, etc.
- Consumer non-durables: Products that are directly used by consumers and can’t be preserved for long periods. E.g.: Soyabean Oil, Full-cream/ Toned/ Skimmed milk, Milk Powder, Maida, Rice, Biscuits/ cookies, Sugar, Tea, Cigarettes, etc.
| Year | Primary goods | Capital goods | Intermediate goods | Infrastructure construction goods | Consumer durables | Consumer non durables |
|---|---|---|---|---|---|---|
| 2024-25 | 153.5 | 112.6 | 164.0 | 188.2 | 128.0 | 151.4 |
| 2023-24 | 147.7 | 106.6 | 157.3 | 176.3 | 118.6 | 153.7 |
| 2022-23 | 139.2 | 100.3 | 149.4 | 160.7 | 114.5 | 147.7 |
| 2021-22 | 129.5 | 88.7 | 143.9 | 148.2 | 113.8 | 146.7 |
| 2020-21 | 118.1 | 75.9 | 124.7 | 124.7 | 101.2 | 142.1 |
| 2019-20 | 127.0 | 93.3 | 137.7 | 136.6 | 119.0 | 145.3 |
| 2018-19 | 126.1 | 108.4 | 126.2 | 141.7 | 130.4 | 145.5 |
| 2017-18 | 121.8 | 105.6 | 125.1 | 132.0 | 123.6 | 139.9 |
| 2016-17 | 117.5 | 101.5 | 122.3 | 125.0 | 122.6 | 126.5 |
| 2015-16 | 112.0 | 98.4 | 118.4 | 120.3 | 119.1 | 117.2 |
| 2014-15 | 106.7 | 95.5 | 116.6 | 117.0 | 115.2 | 114.2 |
| 2013-14 | 102.8 | 96.6 | 109.9 | 111.4 | 110.8 | 110.0 |
| 2012-13 | 100.5 | 100.3 | 105.1 | 105.4 | 104.9 | 106.1 |
We would like to highlight that IIP (Basic or Use-Based) is a production volume based index and not a price based
However, in the new series, data for 109 item groups (weight: 19.22%) is collected in value terms. Many of these item groups have production span of generally more than one month for which data is reported on ‘work in progress’. This helps to avoid sudden jumps if the data were collected in quantity terms. The value data reported for such items need to be deflated using an appropriate price deflator.
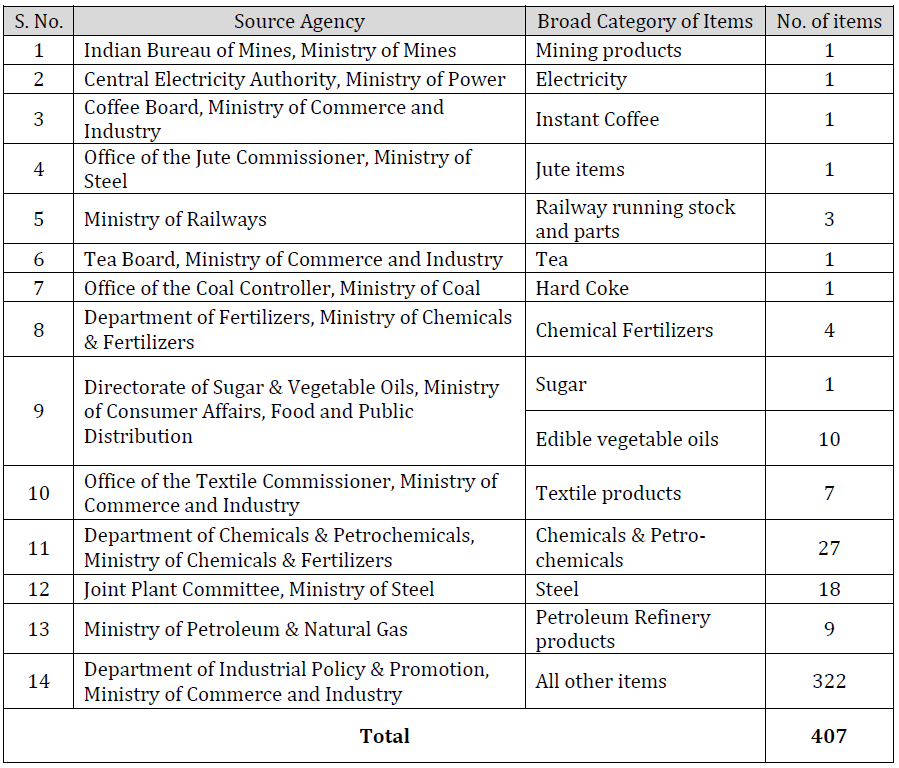
Data for compilation of IIP in new series is sourced from 14 source agencies in various Ministries/Departments. Each of the source agencies based on their administrative domain, collect the production data of the concerned list of item groups, and provide the same to Economic Statistics Division, CSO after due validation. The details of source agencies and broad subject of data collection is as given in Table below: