India Emissions Trend
The United Nations Framework Convention on Climate Change (UNFCCC) was adopted in 1992, in recognition of the concern that food security and economic development in the future may be adversely affected as a result of the discernible change observed in the climate since pre-industrial times. This change is mainly attributed to the continuously increasing concentration of Green House Gases (GHGs) in the atmosphere resulting from anthropogenic activities
Therefore, central to any climate change study is the assessment of GHG inventory that identifies and quantifies a country’s primary anthropogenic sources and sinks of GHGs
The UNFCCC stipulates that each party to the convention should develop, periodically update, publish and make available to the Conference of Parties, a national inventory of anthropogenic emissions by sources and removals by sinks of all GHGs not controlled by the Montreal Protocol, using comparable methodologies
India ratified the Convention in November 1993. As a non-Annex 1 nation under the Convention, the inventory information to be provided by India is according to the guidelines stipulated for Parties not included in Annex I to the UNFCCC
India submitted its Initial National Communication to UNFCCC in June 2004, and the GHG inventory was prepared for the base year 1994 as stipulated
The 21st session of the UNFCCC's Conference of the Parties (COP21) took place in Paris in 2015, where 195 countries adopted the Paris Agreement. The agreement aims to limit the global average temperature increase above pre-industrial levels to well below 2°C, and to pursue efforts to limit the increase to 1.5°C and peak greenhouse gas emissions as soon as possible. It entered into force on November 4, 2016, requiring countries to submit Nationally Determined Contributions (NDCs) outlining their climate target
India submits Biennial Update Reports (BURs) to the UNFCCC every two years to track progress. These reports update the national GHG inventories, detail mitigation actions, and highlight the support received, including efforts to reduce emissions
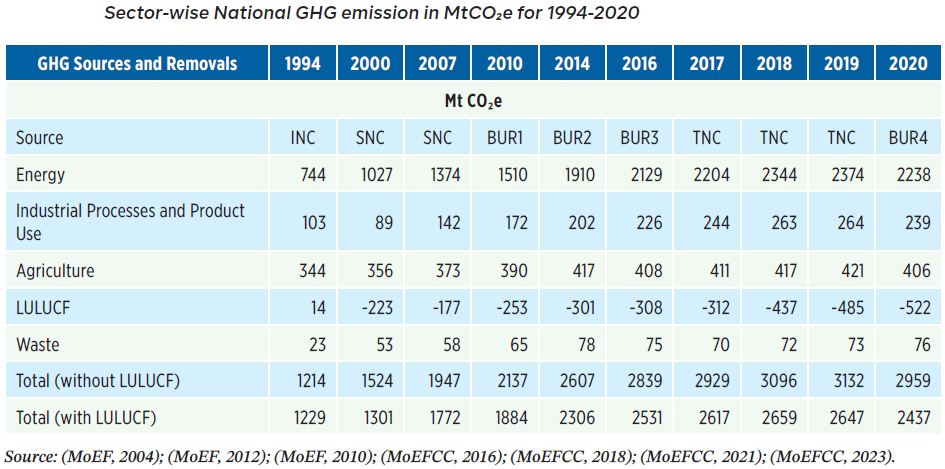
India submitted its 4th Biennial Update Report (BUR-4) to the UNFCCC on 30th December 2024. The report shows a 7.93% reduction in total GHG emissions in 2020 with respect to 2019. Given the complexity of the exercise, there is a considerable time lag, for example the 30th December 2024 submits data for the year 2020
Excluding Land Use, Land-Use Change, and Forestry (LULUCF), India’s emissions were 2,959 million tonnes of CO2e (carbon dioxide equivalent, way to measure the impact of GHG). Including LULUCF, net emissions were 2,437 million tonnes of CO2e
The energy sector was the largest contributor, accounting for 75.66% of emissions
| Year | Energy MMTPA CO2e | Industrial Processes and Product Use MMTPA CO2e | Agriculture MMTPA CO2e | Waste MMTPA CO2e | Total (without LULUCF) MMTPA CO2e | LULUCF MMTPA | Total (with LULUCF) MMTPA CO2e | Share Energy percent | Share Industrial Processes and Product Use percent | Share Agriculture percent | Share Waste percent | Total without LULUCF |
|---|---|---|---|---|---|---|---|---|---|---|---|---|
| 2020 | 2238.0 | 239.0 | 406.0 | 76.0 | 2959.0 | -522.0 | 2437.0 | 75.6 | 8.1 | 13.7 | 2.6 | 100.0 |
| 2019 | 2374.0 | 264.0 | 421.0 | 73.0 | 3132.0 | -485.0 | 2647.0 | 75.8 | 8.4 | 13.4 | 2.3 | 100.0 |
| 2018 | 2344.0 | 263.0 | 417.0 | 72.0 | 3096.0 | -437.0 | 2659.0 | 75.7 | 8.5 | 13.5 | 2.3 | 100.0 |
| 2017 | 2204.0 | 244.0 | 411.0 | 70.0 | 2929.0 | -312.0 | 2617.0 | 75.2 | 8.3 | 14.0 | 2.4 | 100.0 |
| 2016 | 2129.0 | 226.0 | 408.0 | 75.0 | 2839.0 | -308.0 | 2531.0 | 75.0 | 8.0 | 14.4 | 2.6 | 100.0 |
| 2015 | 2092.1 | 214.0 | 409.7 | 73.2 | 2789.1 | -296.1 | 2493.0 | 75.0 | 7.7 | 14.7 | 2.6 | 100.0 |
| 2014 | 1910.0 | 202.0 | 417.0 | 78.0 | 2607.0 | -301.0 | 2306.0 | 73.3 | 7.7 | 16.0 | 3.0 | 100.0 |
| 2013 | 1813.6 | 192.6 | 413.7 | 76.5 | 2496.4 | -364.6 | 2131.8 | 72.6 | 7.7 | 16.6 | 3.1 | 100.0 |
| 2012 | 1747.7 | 196.0 | 408.4 | 73.2 | 2425.4 | -364.2 | 2061.1 | 72.1 | 8.1 | 16.8 | 3.0 | 100.0 |
| 2011 | 1651.9 | 185.5 | 409.4 | 70.4 | 2317.3 | -210.9 | 2106.4 | 71.3 | 8.0 | 17.7 | 3.0 | 100.0 |
| 2010 | 1510.0 | 172.0 | 390.0 | 65.0 | 2137.0 | -253.0 | 1884.0 | 70.7 | 8.0 | 18.2 | 3.0 | 100.0 |
| 2007 | 1374.0 | 142.0 | 373.0 | 58.0 | 1947.0 | -177.0 | 1772.0 | 70.6 | 7.3 | 19.2 | 3.0 | 100.0 |
| 2000 | 1027.0 | 89.0 | 356.0 | 53.0 | 1524.0 | -223.0 | 1301.0 | 67.4 | 5.8 | 23.4 | 3.5 | 100.0 |
| 1994 | 744.0 | 103.0 | 344.0 | 23.0 | 1214.0 | 14.0 | 1229.0 | 61.3 | 8.5 | 28.3 | 1.9 | 100.0 |
Emissions are quite often reported in Giga Grams (Gg). Even India's BURs report emissions in Gg. In the Table above, we have converted them into MMTPA for easier reference
For example, India's BUR-4 presents country's emissions as below:
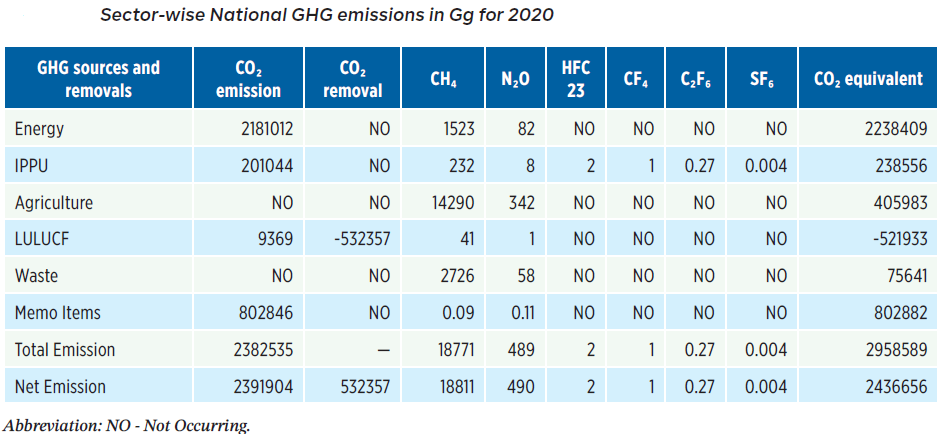
If we see our section on SI Prefixes, 1 giga = 10^9, so 1 Gg = 10^9 grams or 1,000 tonnes. Put other way, 1 Gg=1000/10^6 = 0.001 million tons, so if we divide Gg number by 1000, we get million tonnes
For ease of reference, India's BUR-4 also presents data in MMTPA, as below