Jawaharlal Nehru Port Commoditywise
Commissioned on 26th May, 1989, Jawaharlal Nehru port has come a long way by becoming a world-class international container handling port
It is situated along the eastern shore of Mumbai harbour off Elephanta Island
JNPA is an all-weather tidal Port having 17 berths with a capacity of 125.30 MTPA
Currently, 5 fully automated Container Terminals with a total container handling capacity of 7.7 Million TEUs operate at JNPA. These Container Terminals are operating in PPP mode in partnership with major global terminal operators, namely, DP World (2 terminals), AP Mollar Terminals (APM terminals), Port of Singapore Authority (PSA) and M/s. JM Baxi Ports & Logistics (NSFT)
Bharat Mumbai Container Terminal Pvt. Ltd. (BMCTPL), SPV of Port of Singapore (PSA) with a total project capacity of 60 MMT (4.8 million TEUs) commenced operations under Phase -1 (2.4 million TEUS) on 18th February, 2018. Phase-II (2.4 million TEUs) was expected to start in 2025
Containerization started in India in 1973 in a limited way with the creation of interim container handling facilities at Mumbai and Cochin Ports
Since then, container traffic has steadily increased over the years, in tune with the increasing use of containers in international trade
JNPT is the premier container port in India. For the year 2023-24, JNPT handled 2.4 million tons of POL, out of a total traffic of 85.8 million tons, accounting for 2.8% of total. Other than this, everything is reported as "Others" amounting to 83.4 million tons. This is because Container traffic is the major one at JNPT. During the year, JNPT handled 6.43 million Twenty-foot Equivalent Units (TEUs)
The total traffic of 85.8 million tons comprised 78.1 million tons of container cargo and 7.70 million of bulk cargo
The twenty-foot equivalent unit (abbreviated TEU) is a general unit of cargo capacity, often used for container ships. It is based on the volume of a 20-foot-long intermodal container, a standard-sized metal box that can be easily transferred between different modes of transportation, such as ships, trains, and trucks. Its width is 8 ft, and height is 8 feet 6 inches (most common), but can vary between 4 feet 3 inches to 9 feet 6 inches
TEU is a measure of volume, not weight, and its weight capacity varies. The multiple for converting TEUs into tons depends on what is loaded. In many instances of data reporting, a commonly used conversion factor for TEU to tons is 14 metric tons per TEU. However, it is to be clearly noted that this is an average for statistical and reporting purposes, as the actual weight of a TEU can vary significantly, and is not uniformly followed even for reporting purposes
| Year | POL Crude and Products MMTPA | Fertilisers MMTPA | Fertiliser Raw Materials MMTPA | Iron Ore MMTPA | Coal MMTPA | Food Grains MMTPA | Others MMTPA | Total JN Port MMTPA | Share POL Crude and Products pct | Share Fertilisers pct | Share Fertiliser Raw Materials pct | Share Iron Ore pct | Share Coal pct | Share Food Grains pct | Share Others pct | Total |
|---|---|---|---|---|---|---|---|---|---|---|---|---|---|---|---|---|
| 2023-24 | 2.4 | 0.0 | 0.0 | 0.0 | 0.0 | 0.0 | 83.4 | 85.8 | 2.8 | 0.0 | 0.0 | 0.0 | 0.0 | 0.0 | 97.2 | 100.0 |
| 2022-23 | 2.3 | 0.0 | 0.0 | 0.0 | 0.0 | 0.0 | 81.6 | 83.9 | 2.7 | 0.0 | 0.0 | 0.0 | 0.0 | 0.0 | 97.3 | 100.0 |
| 2021-22 | 2.1 | 0.0 | 0.0 | 0.0 | 0.0 | 0.0 | 73.9 | 76.0 | 2.8 | 0.0 | 0.0 | 0.0 | 0.0 | 0.0 | 97.2 | 100.0 |
| 2020-21 | 2.6 | 0.0 | 0.0 | 0.0 | 0.0 | 0.0 | 62.3 | 64.8 | 3.9 | 0.0 | 0.0 | 0.0 | 0.0 | 0.0 | 96.1 | 100.0 |
| 2019-20 | 3.0 | 0.0 | 0.0 | 0.0 | 0.0 | 0.0 | 65.4 | 68.4 | 4.4 | 0.0 | 0.0 | 0.0 | 0.0 | 0.0 | 95.6 | 100.0 |
| 2018-19 | 4.0 | 0.0 | 0.0 | 0.0 | 0.0 | 0.0 | 66.7 | 70.7 | 5.7 | 0.0 | 0.0 | 0.0 | 0.0 | 0.0 | 94.3 | 100.0 |
| 2017-18 | 4.0 | 0.0 | 0.0 | 0.0 | 0.0 | 0.0 | 62.0 | 66.0 | 6.1 | 0.0 | 0.0 | 0.0 | 0.0 | 0.0 | 93.9 | 100.0 |
| 2016-17 | 3.8 | 0.0 | 0.0 | 0.0 | 0.0 | 0.0 | 58.3 | 62.2 | 6.2 | 0.0 | 0.0 | 0.0 | 0.0 | 0.0 | 93.8 | 100.0 |
| 2015-16 | 3.4 | 0.0 | 0.0 | 0.0 | 0.0 | 0.0 | 60.6 | 64.0 | 5.3 | 0.0 | 0.0 | 0.0 | 0.0 | 0.0 | 94.7 | 100.0 |
| 2014-15 | 3.3 | 0.0 | 0.0 | 0.0 | 0.0 | 0.0 | 60.5 | 63.8 | 5.2 | 0.0 | 0.0 | 0.0 | 0.0 | 0.0 | 94.8 | 100.0 |
| 2013-14 | 4.1 | 0.0 | 0.0 | 0.0 | 0.0 | 0.0 | 58.2 | 62.3 | 6.6 | 0.0 | 0.0 | 0.0 | 0.0 | 0.0 | 93.4 | 100.0 |
| 2012-13 | 4.1 | 0.0 | 0.0 | 0.0 | 0.0 | 0.0 | 60.4 | 64.5 | 6.4 | 0.0 | 0.0 | 0.0 | 0.0 | 0.0 | 93.6 | 100.0 |
| 2011-12 | 4.8 | 0.0 | 0.0 | 0.0 | 0.0 | 0.0 | 60.9 | 65.7 | 7.4 | 0.0 | 0.0 | 0.0 | 0.0 | 0.0 | 92.6 | 100.0 |
| 2010-11 | 5.0 | 0.0 | 0.9 | 0.0 | 0.0 | 0.0 | 58.4 | 64.3 | 7.8 | 0.0 | 1.4 | 0.0 | 0.0 | 0.0 | 90.8 | 100.0 |
| 2009-10 | 4.9 | 0.0 | 0.0 | 0.0 | 0.0 | 0.0 | 55.8 | 60.8 | 8.1 | 0.0 | 0.0 | 0.0 | 0.0 | 0.0 | 91.9 | 100.0 |
| 2008-09 | 4.6 | 0.0 | 0.0 | 0.0 | 0.0 | 0.0 | 52.7 | 57.3 | 7.9 | 0.0 | 0.0 | 0.0 | 0.0 | 0.0 | 92.1 | 100.0 |
| 2007-08 | 2.2 | 0.0 | 0.0 | 0.0 | 0.0 | 0.0 | 53.7 | 55.8 | 3.9 | 0.0 | 0.0 | 0.0 | 0.0 | 0.0 | 96.1 | 100.0 |
| 2006-07 | 2.6 | 0.0 | 0.0 | 0.0 | 0.0 | 0.0 | 42.2 | 44.8 | 5.9 | 0.0 | 0.0 | 0.0 | 0.0 | 0.0 | 94.1 | 100.0 |
| 2005-06 | 2.5 | 0.0 | 0.0 | 0.0 | 0.0 | 0.0 | 35.3 | 37.8 | 6.7 | 0.0 | 0.1 | 0.0 | 0.0 | 0.0 | 93.2 | 100.0 |
| 2004-05 | 2.5 | 0.0 | 0.0 | 0.0 | 0.0 | 0.0 | 30.3 | 32.8 | 7.5 | 0.0 | 0.1 | 0.0 | 0.0 | 0.0 | 92.4 | 100.0 |
| 2003-04 | 1.9 | 0.1 | 0.1 | 0.0 | 0.0 | 0.0 | 29.0 | 31.2 | 6.2 | 0.3 | 0.4 | 0.0 | 0.0 | 0.0 | 93.1 | 100.0 |
| 2002-03 | 1.9 | 0.1 | 0.2 | 0.0 | 0.0 | 0.0 | 24.7 | 26.8 | 7.0 | 0.4 | 0.8 | 0.0 | 0.0 | 0.0 | 91.8 | 100.0 |
| 2001-02 | 1.7 | 0.3 | 0.1 | 0.0 | 0.0 | 0.0 | 20.4 | 22.5 | 7.8 | 1.2 | 0.3 | 0.0 | 0.0 | 0.1 | 90.6 | 100.0 |
| 2000-01 | 1.8 | 0.2 | 0.1 | 0.0 | 0.0 | 0.0 | 16.4 | 18.6 | 9.7 | 1.3 | 0.8 | 0.0 | 0.0 | 0.0 | 88.1 | 100.0 |
| 1999-00 | 1.4 | 0.6 | 0.2 | 0.0 | 0.0 | 0.6 | 12.2 | 15.0 | 9.4 | 4.2 | 1.1 | 0.3 | 0.0 | 3.7 | 81.3 | 100.0 |
| 1998-99 | 1.3 | 0.8 | 0.1 | 0.5 | 0.0 | 0.4 | 8.6 | 11.7 | 10.8 | 6.8 | 0.8 | 4.5 | 0.0 | 3.6 | 73.5 | 100.0 |
| 1997-98 | 0.7 | 0.9 | 0.1 | 0.7 | 0.0 | 0.4 | 6.2 | 8.9 | 7.7 | 9.9 | 0.8 | 7.4 | 0.0 | 4.0 | 70.2 | 100.0 |
| 1996-97 | 0.3 | 1.0 | 0.4 | 0.7 | 0.0 | 0.4 | 5.4 | 8.1 | 3.1 | 12.2 | 4.5 | 8.5 | 0.0 | 4.7 | 67.0 | 100.0 |
| 1995-96 | 0.1 | 1.7 | 0.2 | 0.6 | 0.0 | 0.1 | 4.1 | 6.9 | 2.0 | 25.0 | 2.6 | 9.4 | 0.0 | 1.0 | 60.0 | 100.0 |
| 1994-95 | 0.0 | 1.2 | 0.1 | 0.0 | 0.0 | 0.0 | 3.7 | 5.0 | 0.0 | 23.7 | 2.5 | 0.0 | 0.0 | 0.0 | 73.8 | 100.0 |
| 1993-94 | 0.0 | 0.9 | 0.0 | 0.0 | 0.0 | 0.3 | 2.2 | 3.4 | 0.0 | 25.2 | 0.7 | 0.0 | 0.0 | 8.1 | 66.0 | 100.0 |
| 1992-93 | 0.0 | 0.6 | 0.1 | 0.0 | 0.0 | 0.6 | 1.7 | 3.0 | 0.0 | 19.6 | 3.8 | 0.0 | 0.0 | 19.2 | 57.5 | 100.0 |
| 1991-92 | 0.0 | 0.6 | 0.8 | 0.0 | 0.0 | 0.0 | 1.4 | 2.8 | 0.0 | 22.3 | 29.3 | 0.0 | 0.0 | 0.0 | 48.4 | 100.0 |
| 1990-91 | 0.0 | 0.5 | 0.9 | 0.0 | 0.0 | 0.0 | 0.7 | 2.0 | 0.0 | 25.5 | 42.0 | 0.0 | 0.0 | 0.0 | 32.4 | 100.0 |
If we scroll down the above Table, total traffic at JNPA Port was 2 million tonnes in 1990-91, with Fertilisers (25.5%) and Fertiliser Raw Materials (42.0%) accounting for the majority of the traffic
By 1999-2000, total traffic had increased to 15 million tonnes, of which "others", which includes Container traffic, was 12.2 million tonnes or 81.3%
The proportion of "Other" traffic has continued to increase and accounted for 97.2% of total traffic at JNPA in 2023-24
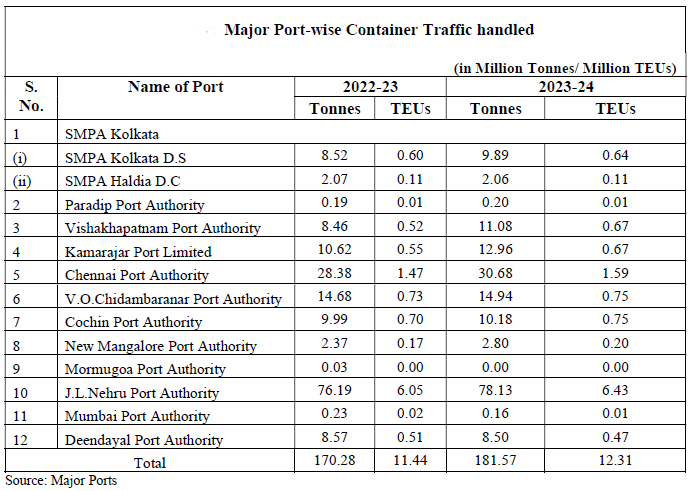
View the trends graphicallyTable below captures Major Port-wise Container traffic handled, both in Million Tonnes and in Million TEUs
At the All-India level, the Container traffic in 2023-24 was 181.57 million tonnes, corresponding to 12.31 million TEUs. This translates into an average multiple of 14.75