Sectoral Natural Gas Consumption
(Source: MOPNG / PPAC)
Natural gas consumption is presented into two broad categories, for use in energy sector (also referred to as use for energy purpose, essentially being used as fuel) and in non-energy sector (use for non-energy purpose, essentially being used as feedstock)
The former comprises use in Power, City Gas Distribution (CGD), Refinery, as Internal Consumption (I/C), for pipeline (P/L) System Agriculture (Tea Plantation), Industrial, Manufacturing, Other/Misc , while the latter comprises use in Fertilizer, Petrochemical, LPG Shrinkage and Sponge Iron/Steel
LPG Shrinkage can be classified either as use for energy purpose or for non-energy purpose. Since it is shown separately, the main purpose of capturing gas consumption in this segment is served, without getting into the debate
Variation between Availability and Consumption is attributed to factors like stock changes, conversion factors / rounding off, provisional data in certain cases, and other factors like updation of reporting exercise
Table below captures trend in sectorial sales of natural gas in India
For 2024-25, total sectorial sales were 71.3 BCM, or ~195.4 MMSCMD. Power accounted for 8.9 BCM or 12.5%, CGD accounted for 15.1 BCM or 21.1%, while Fertilisers accounted for 20.5 BCM or 28.8% of total natural gas consumption in India
| Year | Power BCM | Industrial and Manufacturing BCM | CGD BCM | Agriculture BCM | Internal Consumption BCM | Refinery BCM | LPG Shrinkage BCM | Miscellaneous BCM | Sub Total Energy Purpose BCM | Fertilizers BCM | Petrochemical BCM | Sponge Iron BCM | Sub Total Non Energy Purpose BCM | Total Sectorial Sales BCM | Total Consumption BCM | Total Consumption MMSCMD | pct of Sales Energy Purpose | pct of Sales Non Energy Purpose | Total | pct Share of Power in Toal Sales | pct Share of CGD in Toal Sales | pct Share of Fertilisers in Toal Sales |
|---|---|---|---|---|---|---|---|---|---|---|---|---|---|---|---|---|---|---|---|---|---|---|
| 2024-25 | 8.9 | 2.8 | 15.1 | 0.2 | 2.0 | 5.9 | 0.9 | 10.4 | 46.0 | 20.5 | 3.4 | 1.3 | 25.2 | 71.2 | 71.3 | 195.4 | 64.6 | 35.4 | 100.0 | 12.5 | 21.1 | 28.8 |
| 2023-24 | 9.1 | 1.5 | 13.5 | 0.1 | 1.9 | 5.8 | 1.0 | 10.9 | 43.9 | 21.0 | 2.7 | 1.2 | 24.9 | 68.8 | 67.5 | 184.5 | 63.8 | 36.2 | 100.0 | 13.2 | 19.6 | 30.6 |
| 2022-23 | 8.2 | 0.9 | 12.0 | 0.2 | 1.8 | 3.9 | 1.0 | 8.5 | 36.4 | 19.4 | 2.0 | 1.0 | 22.3 | 58.7 | 60.0 | 164.3 | 62.0 | 38.0 | 100.0 | 13.9 | 20.5 | 33.0 |
| 2021-22 | 10.2 | 0.8 | 12.2 | 0.2 | 0.5 | 5.3 | 1.1 | 9.2 | 39.4 | 18.1 | 2.9 | 1.1 | 22.1 | 61.5 | 64.2 | 175.8 | 64.1 | 35.9 | 100.0 | 16.5 | 19.8 | 29.4 |
| 2020-21 | 10.8 | 0.6 | 9.2 | 0.2 | 0.4 | 7.9 | 0.9 | 4.6 | 34.6 | 17.8 | 3.1 | 0.6 | 21.5 | 56.1 | 61.0 | 167.1 | 61.7 | 38.3 | 100.0 | 19.3 | 16.4 | 31.7 |
| 2019-20 | 11.1 | 0.7 | 10.9 | 0.2 | 0.5 | 7.8 | 0.9 | 4.2 | 36.2 | 16.1 | 3.6 | 0.6 | 20.3 | 56.5 | 64.1 | 175.3 | 64.2 | 35.8 | 100.0 | 19.6 | 19.3 | 28.5 |
| 2018-19 | 12.0 | 1.1 | 9.2 | 0.2 | 0.5 | 7.0 | 0.9 | 3.4 | 34.3 | 15.0 | 3.4 | 1.1 | 19.5 | 53.8 | 60.8 | 166.6 | 63.8 | 36.2 | 100.0 | 22.3 | 17.1 | 27.8 |
| 2017-18 | 12.0 | 1.0 | 8.6 | 0.2 | 0.5 | 6.5 | 0.8 | 3.2 | 32.9 | 14.7 | 4.0 | 1.3 | 20.0 | 52.8 | 59.2 | 162.1 | 62.2 | 37.8 | 100.0 | 22.8 | 16.2 | 27.8 |
| 2016-17 | 11.6 | 0.8 | 7.4 | 0.2 | 0.5 | 5.4 | 0.8 | 3.9 | 30.5 | 15.4 | 4.2 | 0.9 | 20.5 | 51.0 | 55.7 | 152.6 | 59.8 | 40.2 | 100.0 | 22.8 | 14.4 | 30.3 |
| 2015-16 | 10.9 | 0.5 | 5.5 | 0.2 | 0.4 | 5.1 | 0.8 | 4.1 | 27.4 | 16.1 | 3.7 | 0.5 | 20.4 | 47.8 | 52.5 | 143.5 | 57.3 | 42.7 | 100.0 | 22.8 | 11.4 | 33.7 |
| 2014-15 | 10.7 | 0.5 | 5.4 | 0.2 | 0.4 | 4.6 | 1.0 | 5.9 | 28.7 | 15.2 | 2.9 | 0.2 | 18.2 | 47.0 | 51.3 | 140.5 | 61.2 | 38.8 | 100.0 | 22.8 | 11.5 | 32.4 |
| 2013-14 | 11.3 | 0.3 | 5.9 | 0.2 | 0.4 | 4.0 | 1.0 | 7.5 | 30.4 | 15.9 | 2.4 | 0.3 | 18.5 | 49.0 | 52.4 | 143.5 | 62.1 | 37.9 | 100.0 | 23.0 | 12.1 | 32.4 |
| 2012-13 | 16.1 | 0.3 | 5.8 | 0.2 | 0.4 | 3.9 | 1.0 | 8.0 | 35.6 | 14.7 | 2.5 | 1.1 | 18.3 | 53.9 | 57.4 | 157.2 | 66.0 | 34.0 | 100.0 | 29.8 | 10.7 | 27.3 |
| 2011-12 | 22.6 | 0.3 | 5.6 | 0.2 | 0.4 | 4.3 | 1.1 | 9.1 | 43.5 | 14.0 | 1.9 | 1.3 | 17.2 | 60.7 | 64.5 | 176.1 | 71.7 | 28.3 | 100.0 | 37.3 | 9.2 | 23.1 |
For the benefit of our readers, Table below presents PNGRB's projections of sectoral gas demand for 2030 and 2040, under its two scenarios, Good to Go (GtG) scenario and Good to Best (GtB) scenario
Good to Go (GtG) scenario assumes moderate growth and expected developments based on current trends and commitments
Good to Best (GtB) scenario considers accelerated progress, favourable policy implementation, and enhanced investments leading to higher-than-expected growth
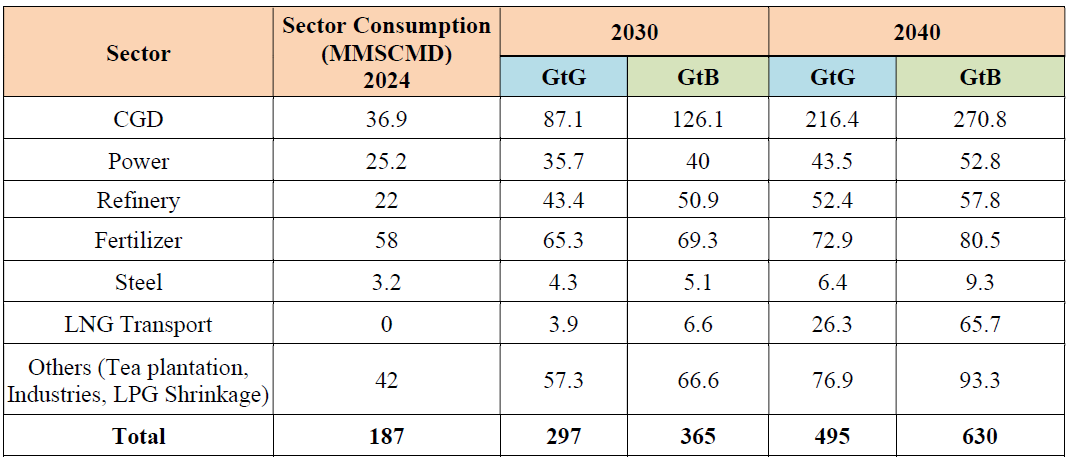
As can be seen, the Good to Go scenario expects India's gas demand to be 297 MMSCMD by 2030 and 495 MMSCMD by 2040, from the current level of 187 MMSCMD, whereas Good to Best scenario expects the gas demand for the same years to be 365 MMSCM and 630 MMSCMD respectively