Statewise Installed Capacity
Central Electricity Authority's All India Electricity Statistics General Review 2025 Report of November 2025 captures data upto 2023-24
Table below presents annual trend in state-wise installed electricity generation capacities, with 2023-24 capacities adding up to an all-India installed capacity of 441,970 MW (~442 GW)
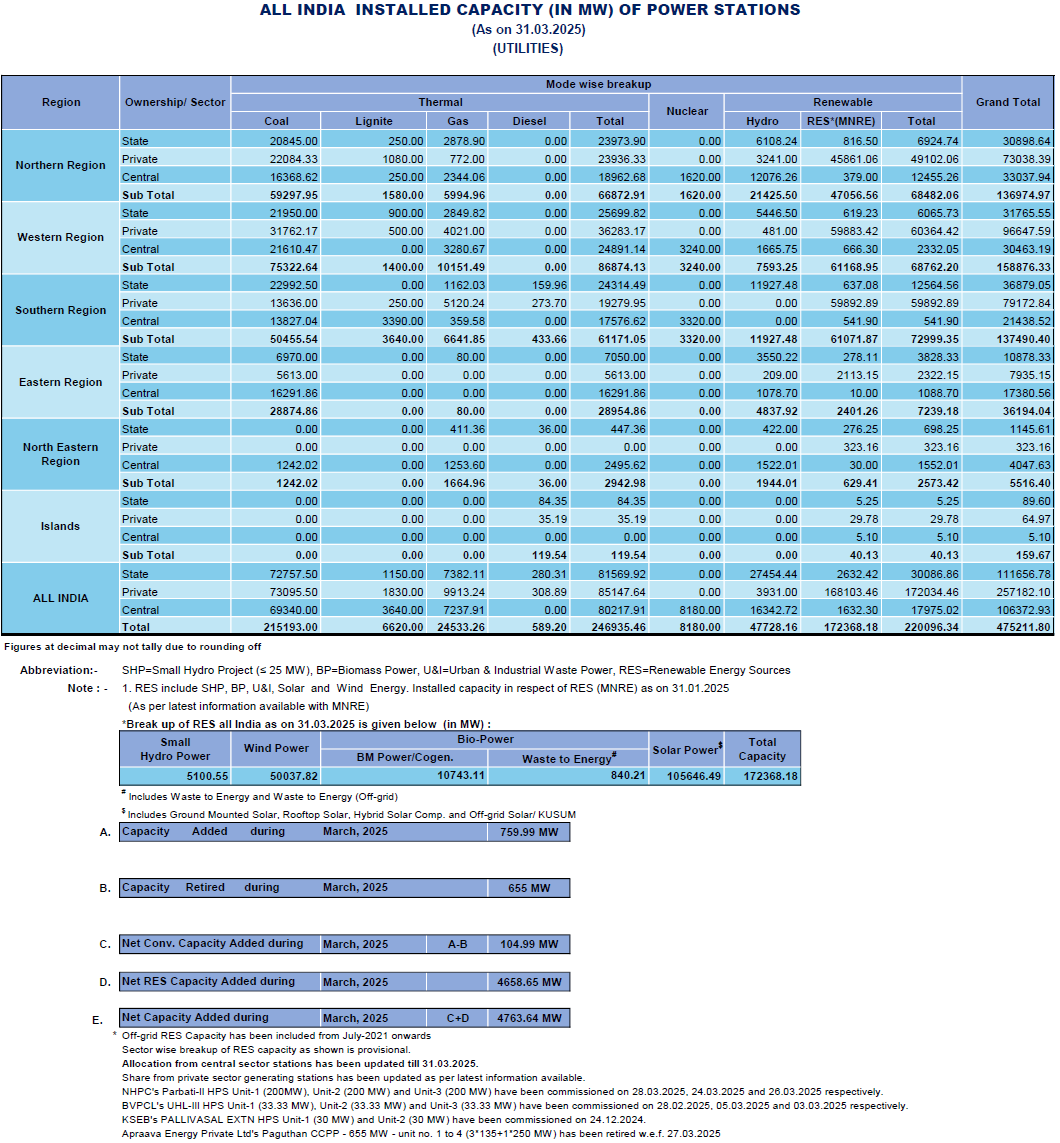
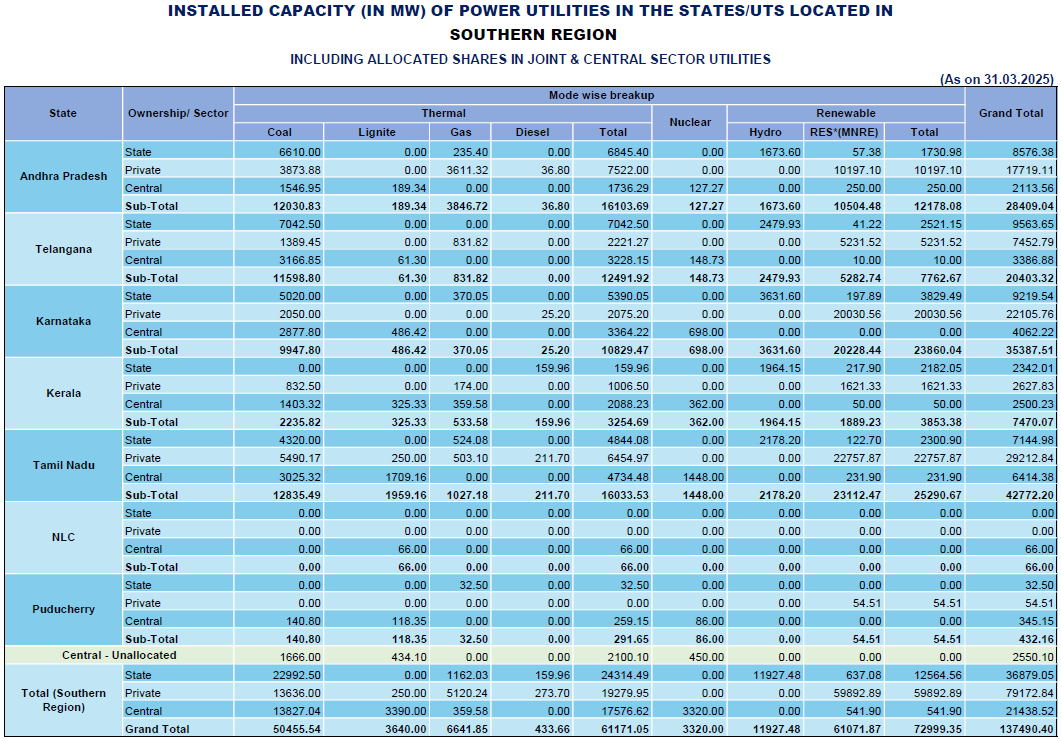
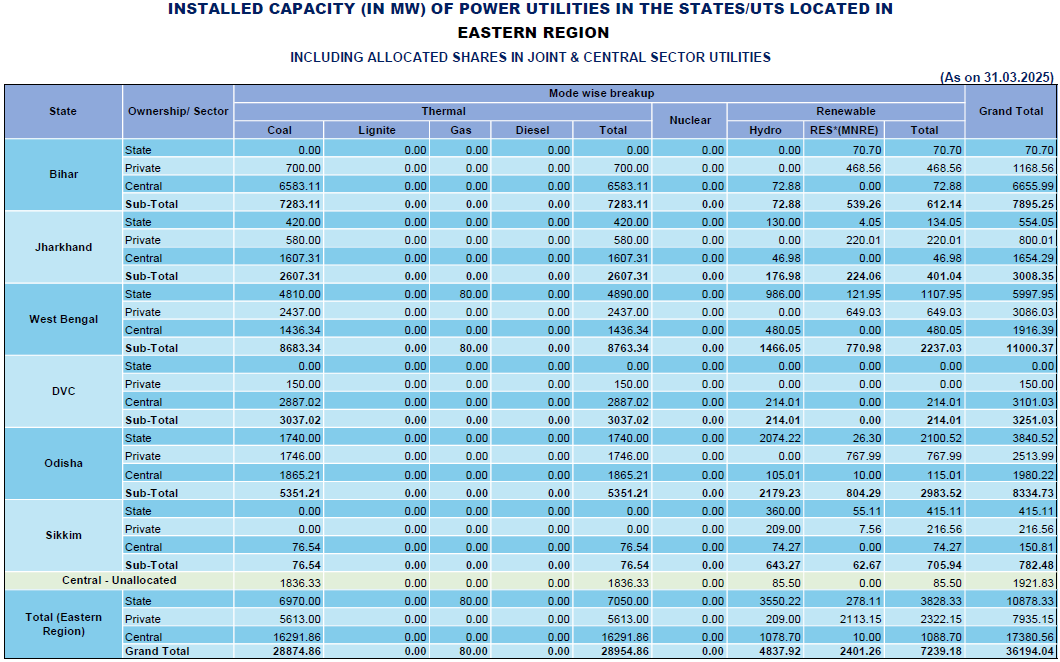
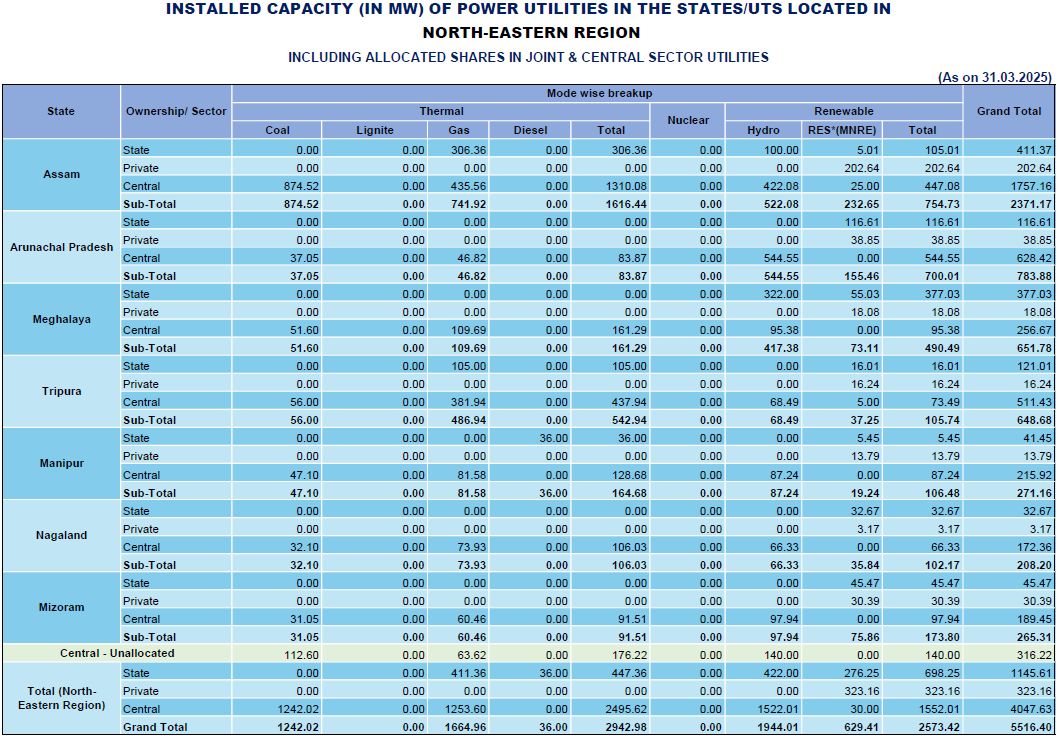
CEA publishes Monthly Installed Capacity Report. All-India installed capacity as on 31st March 2025 was 475,211.8 MW (~475 GW). We have captured India's Region-wise / state-wise installed capacities as on the said date at the end of this page
| Year | Andaman and Nicobar Islands MW | Andhra Pradesh MW | Arunachal Pradesh MW | Assam MW | Bihar MW | Chandigarh MW | Chhattisgarh MW | Dadra Nagar Haveli Daman Diu MW | Delhi MW | Goa MW | Gujarat MW | Haryana MW | Himachal Pradesh MW | Jammu and Kashmir MW | Jharkhand MW | Karnataka MW | Kerala MW | Lakshadweep MW | Madhya Pradesh MW | Maharashtra MW | Manipur MW | Meghalaya MW | Mizoram MW | Nagaland MW | Odisha MW | Puducherry MW | Punjab MW | Rajasthan MW | Sikkim MW | Tamil Nadu MW | Telangana MW | Tripura MW | Uttar Pradesh MW | Uttarakhand MW | West Bengal MW | ALL INDIA |
|---|---|---|---|---|---|---|---|---|---|---|---|---|---|---|---|---|---|---|---|---|---|---|---|---|---|---|---|---|---|---|---|---|---|---|---|---|
| 2023-24 | 128.0 | 27544.0 | 773.0 | 2038.0 | 7514.0 | 235.0 | 14154.0 | 772.0 | 6931.0 | 649.0 | 52425.0 | 13485.0 | 4498.0 | 3850.0 | 2984.0 | 32844.0 | 6669.0 | 32.0 | 27109.0 | 47801.0 | 270.0 | 652.0 | 265.0 | 208.0 | 8125.0 | 428.0 | 14456.0 | 43417.0 | 799.0 | 39806.0 | 19519.0 | 646.0 | 31426.0 | 4459.0 | 10800.0 | 441970.0 |
| 2022-23 | 128.0 | 26676.0 | 773.0 | 1851.0 | 7555.0 | 228.0 | 13803.0 | 759.0 | 6893.0 | 615.0 | 45913.0 | 13008.0 | 4490.0 | 3516.0 | 2666.0 | 31493.0 | 6386.0 | 30.0 | 25646.0 | 45546.0 | 238.0 | 578.0 | 242.0 | 208.0 | 7781.0 | 407.0 | 14245.0 | 38999.0 | 705.0 | 37514.0 | 18066.0 | 589.0 | 29912.0 | 4203.0 | 10714.0 | 416059.0 |
| 2021-22 | 75.0 | 25727.0 | 771.0 | 1844.0 | 7323.0 | 225.0 | 13372.0 | 759.0 | 7617.0 | 608.0 | 42208.0 | 12990.0 | 4532.0 | 3510.0 | 2735.0 | 30578.0 | 5956.0 | 3.0 | 25385.0 | 43446.0 | 278.0 | 621.0 | 234.0 | 206.0 | 7808.0 | 385.0 | 14512.0 | 33544.0 | 743.0 | 35139.0 | 18069.0 | 674.0 | 29230.0 | 3950.0 | 10700.0 | 399497.0 |
| 2020-21 | 75.0 | 25484.0 | 765.0 | 1794.0 | 6321.0 | 215.0 | 13076.0 | 765.0 | 7590.0 | 596.0 | 37893.0 | 12481.0 | 4155.0 | 3478.0 | 2548.0 | 30091.0 | 5837.0 | 1.0 | 25489.0 | 44166.0 | 262.0 | 616.0 | 207.0 | 179.0 | 8594.0 | 380.0 | 14389.0 | 26045.0 | 678.0 | 33695.0 | 17218.0 | 724.0 | 27896.0 | 3731.0 | 11037.0 | 382151.0 |
| 2019-20 | 57.0 | 24854.0 | 379.0 | 1757.0 | 5792.0 | 207.0 | 12835.0 | 717.0 | 7582.0 | 581.0 | 35211.0 | 12290.0 | 4007.0 | 3417.0 | 2514.0 | 29825.0 | 5696.0 | 1.0 | 24821.0 | 43496.0 | 268.0 | 609.0 | 212.0 | 175.0 | 8567.0 | 375.0 | 14205.0 | 25360.0 | 674.0 | 32840.0 | 16024.0 | 764.0 | 26162.0 | 3550.0 | 11027.0 | 370106.0 |
| 2018-19 | 57.0 | 24184.0 | 337.0 | 1710.0 | 4566.0 | 198.0 | 14044.0 | 482.0 | 7237.0 | 567.0 | 32291.0 | 11268.0 | 4068.0 | 3394.0 | 1774.0 | 28075.0 | 5083.0 | 1.0 | 23334.0 | 44144.0 | 259.0 | 582.0 | 206.0 | 170.0 | 7654.0 | 370.0 | 13432.0 | 22589.0 | 962.0 | 31059.0 | 15826.0 | 752.0 | 25130.0 | 3403.0 | 10568.0 | 356100.0 |
| 2017-18 | 52.0 | 23052.0 | 278.0 | 1505.0 | 4341.0 | 188.0 | 13427.0 | 443.0 | 7885.0 | 549.0 | 30794.0 | 11242.0 | 4039.0 | 3428.0 | 1764.0 | 26697.0 | 5075.0 | 1.0 | 20322.0 | 43074.0 | 233.0 | 558.0 | 192.0 | 155.0 | 7338.0 | 367.0 | 14265.0 | 21025.0 | 962.0 | 29903.0 | 15087.0 | 727.0 | 25011.0 | 3356.0 | 10638.0 | 344002.0 |
| 2016-17 | 52.0 | 22298.0 | 274.0 | 1600.0 | 3608.0 | 177.0 | 12060.0 | 424.0 | 7823.0 | 541.0 | 30716.0 | 11056.0 | 3893.0 | 3274.0 | 2237.0 | 21317.0 | 4999.0 | 1.0 | 19618.0 | 41410.0 | 233.0 | 518.0 | 137.0 | 155.0 | 8538.0 | 367.0 | 14162.0 | 19776.0 | 758.0 | 29112.0 | 11501.0 | 727.0 | 23662.0 | 3313.0 | 10383.0 | 326833.0 |
| 2015-16 | 50.0 | 15301.0 | 258.0 | 1369.0 | 3050.0 | 126.0 | 15524.0 | 149.0 | 8326.0 | 412.0 | 29788.0 | 8839.0 | 4463.0 | 3123.0 | 2626.0 | 17854.0 | 4172.0 | 1.0 | 18814.0 | 41335.0 | 206.0 | 510.0 | 120.0 | 141.0 | 9452.0 | 335.0 | 12711.0 | 17920.0 | 414.0 | 25630.0 | 11564.0 | 677.0 | 19680.0 | 3256.0 | 10258.0 | 305163.0 |
| 2014-15 | 70.0 | 11256.0 | 261.0 | 1263.0 | 2809.0 | 118.0 | 13039.0 | 128.0 | 8258.0 | 400.0 | 28881.0 | 8798.0 | 4579.0 | 2611.0 | 2626.0 | 15832.0 | 4107.0 | 11.0 | 15877.0 | 39155.0 | 200.0 | 495.0 | 161.0 | 131.0 | 9067.0 | 330.0 | 10563.0 | 16231.0 | 323.0 | 23258.0 | 9470.0 | 627.0 | 16071.0 | 2852.0 | 9842.0 | 274904.0 |
| 2013-14 | 70.0 | 17728.0 | 249.0 | 1143.0 | 2248.0 | 116.0 | 9793.0 | 128.0 | 7808.0 | 400.0 | 27570.0 | 8323.0 | 3986.0 | 2579.0 | 2580.0 | 14980.0 | 3892.0 | 11.0 | 13847.0 | 35544.0 | 179.0 | 455.0 | 150.0 | 118.0 | 7768.0 | 284.0 | 8417.0 | 14295.0 | 314.0 | 21639.0 | 433.0 | 15457.0 | 2678.0 | 9225.0 | 248554.0 | |
| 2012-13 | 65.0 | 16949.0 | 249.0 | 1140.0 | 1868.0 | 106.0 | 6532.0 | 128.0 | 7163.0 | 430.0 | 26414.0 | 8114.0 | 3770.0 | 2394.0 | 2270.0 | 13759.0 | 3856.0 | 11.0 | 10632.0 | 30354.0 | 179.0 | 455.0 | 150.0 | 117.0 | 6946.0 | 282.0 | 7509.0 | 12156.0 | 206.0 | 19433.0 | 412.0 | 14294.0 | 2561.0 | 8616.0 | 223344.0 | |
| 2011-12 | 65.0 | 16095.0 | 214.0 | 1020.0 | 1834.0 | 102.0 | 5347.0 | 105.0 | 6587.0 | 400.0 | 21972.0 | 6882.0 | 3585.0 | 2307.0 | 3038.0 | 13394.0 | 3828.0 | 11.0 | 8780.0 | 26142.0 | 158.0 | 374.0 | 139.0 | 103.0 | 5996.0 | 280.0 | 7056.0 | 10161.0 | 206.0 | 17602.0 | 265.0 | 13054.0 | 2527.0 | 8567.0 | 199877.0 | |
| 2010-11 | 65.0 | 15036.0 | 213.0 | 979.0 | 1922.0 | 100.0 | 4882.0 | 94.0 | 5802.0 | 387.0 | 15723.0 | 5985.0 | 2327.0 | 2296.0 | 1984.0 | 11546.0 | 3719.0 | 11.0 | 8381.0 | 22645.0 | 158.0 | 290.0 | 139.0 | 103.0 | 5379.0 | 264.0 | 7019.0 | 8975.0 | 201.0 | 15515.0 | 265.0 | 10458.0 | 2455.0 | 8317.0 | 173626.0 | |
| 2009-10 | 65.0 | 13409.0 | 202.0 | 979.0 | 1846.0 | 98.0 | 4769.0 | 89.0 | 4115.0 | 381.0 | 13908.0 | 5071.0 | 2030.0 | 2264.0 | 1943.0 | 10386.0 | 3554.0 | 10.0 | 8324.0 | 21379.0 | 158.0 | 290.0 | 131.0 | 103.0 | 4059.0 | 256.0 | 6922.0 | 7768.0 | 195.0 | 14410.0 | 244.0 | 9984.0 | 2405.0 | 8150.0 | 159398.0 | |
| 2008-09 | 65.0 | 11639.0 | 180.0 | 980.0 | 1970.0 | 93.0 | 3607.0 | 152.0 | 3677.0 | 357.0 | 12110.0 | 4530.0 | 1896.0 | 2159.0 | 2153.0 | 9347.0 | 3514.0 | 11.0 | 8113.0 | 20415.0 | 158.0 | 288.0 | 119.0 | 103.0 | 4072.0 | 257.0 | 6780.0 | 6426.0 | 193.0 | 14089.0 | 243.0 | 9247.0 | 2383.0 | 7732.0 | 147965.0 | |
| 2007-08 | 65.0 | 11867.0 | 180.0 | 955.0 | 1970.0 | 95.0 | 3103.0 | 63.0 | 3689.0 | 352.0 | 11052.0 | 4590.0 | 1858.0 | 1709.0 | 2153.0 | 8877.0 | 3495.0 | 11.0 | 7752.0 | 19583.0 | 158.0 | 288.0 | 119.0 | 103.0 | 4051.0 | 257.0 | 6530.0 | 6243.0 | 191.0 | 13563.0 | 243.0 | 9278.0 | 2356.0 | 7432.0 | 143061.0 | |
| 2006-07 | 71.0 | 11642.0 | 179.0 | 1181.0 | 1629.0 | 92.0 | 1649.0 | 56.0 | 3614.0 | 311.0 | 10270.0 | 3959.0 | 1836.0 | 1626.0 | 2017.0 | 7785.0 | 3496.0 | 10.0 | 6487.0 | 17380.0 | 158.0 | 288.0 | 117.0 | 103.0 | 3476.0 | 260.0 | 6207.0 | 5528.0 | 114.0 | 12376.0 | 244.0 | 9175.0 | 1992.0 | 5331.0 | 128182.0 | |
| 2005-06 | 71.0 | 11325.0 | 179.0 | 1131.0 | 1629.0 | 86.0 | 1649.0 | 52.0 | 3513.0 | 305.0 | 9848.0 | 3915.0 | 1656.0 | 1455.0 | 2017.0 | 7785.0 | 3496.0 | 10.0 | 6199.0 | 16157.0 | 158.0 | 288.0 | 117.0 | 103.0 | 3476.0 | 260.0 | 6266.0 | 7716.0 | 114.0 | 12331.0 | 244.0 | 8597.0 | 1474.0 | 5411.0 | 124287.0 | |
| 2004-05 | 65.0 | 10809.0 | 187.0 | 1133.0 | 1644.0 | 79.0 | 1633.0 | 52.0 | 3426.0 | 305.0 | 9291.0 | 3934.0 | 1687.0 | 1502.0 | 1897.0 | 7557.0 | 3473.0 | 10.0 | 5770.0 | 15669.0 | 159.0 | 299.0 | 121.0 | 120.0 | 3428.0 | 245.0 | 6183.0 | 7607.0 | 141.0 | 11493.0 | 239.0 | 8182.0 | 1443.0 | 5565.0 | 120514.0 |
View the trends graphically
All-India Installed Capacities (Utilities Only) as on 31st March 2025
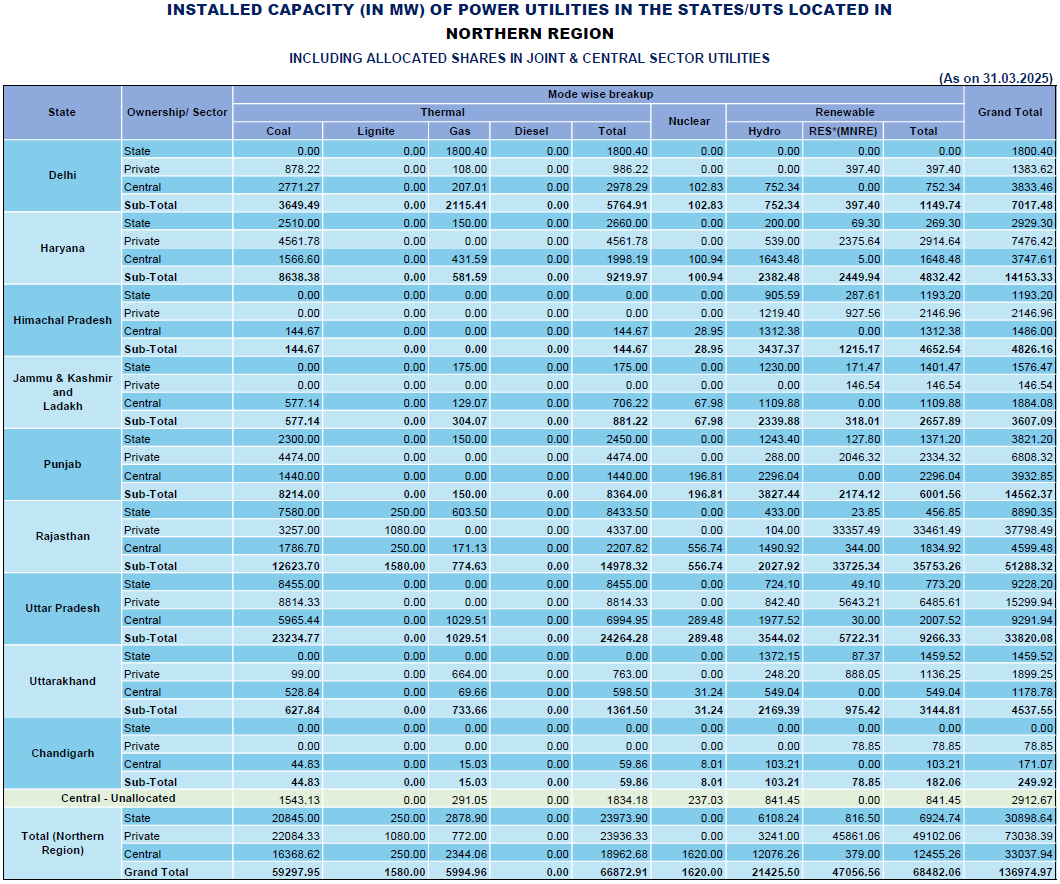
Northern Region Installed Capacities (Utilities Only) as on 31st March 2025
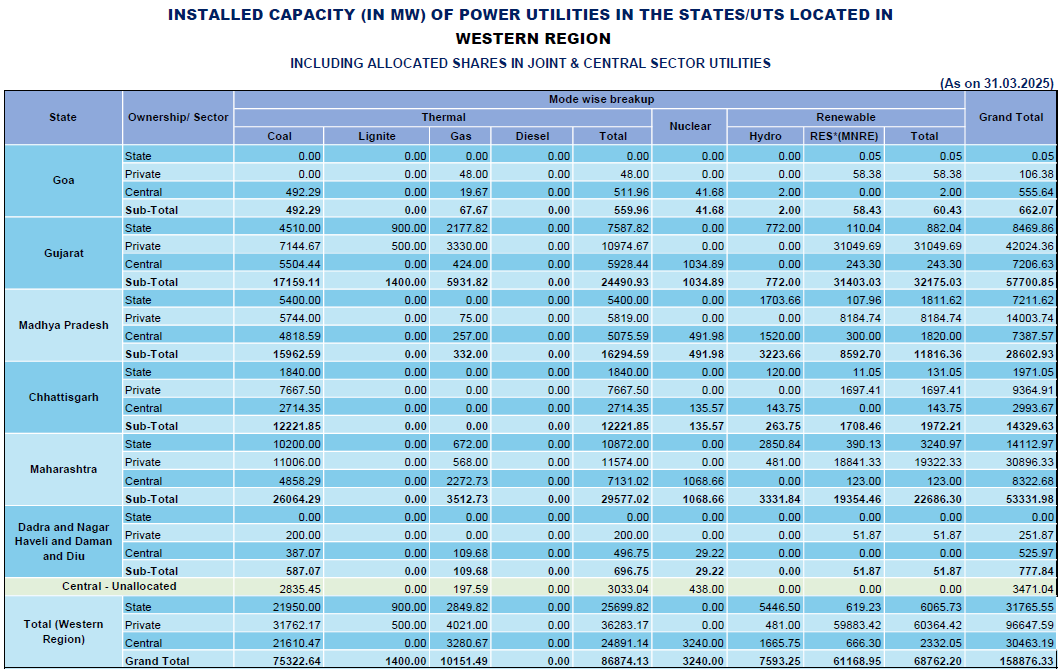
Western Region Installed Capacities (Utilities Only) as on 31st March 2025
Southern Region Installed Capacities (Utilities Only) as on 31st March 2025
Eastern Region Installed Capacities (Utilities Only) as on 31st March 2025
Northeastern Region Installed Capacities (Utilities Only) as on 31st March 2025
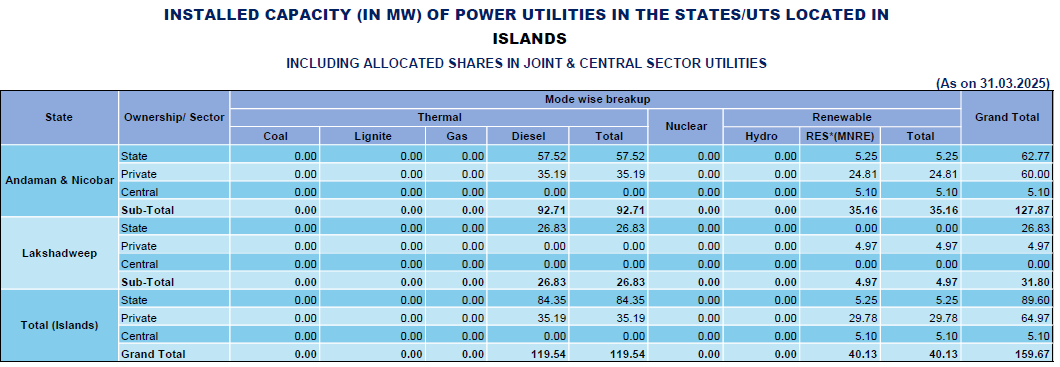
Installed Capacities (Utilities Only) in Islands as on 31st March 2025