Wholesale Price Index Annual
(Source: While we have picked up the data from RBI Handbook of Statistics, it cites the source as: Office of the Economic Adviser, Ministry of Commerce and Industry, Government of India)
Office of the Economic Adviser (OEA) is an attached office of the Department for Promotion of Industry and Internal Trade, Ministry of Commerce & Industry
WPI captures the average movement of wholesale prices of goods and is primarily used as a GDP deflator. WPI(2011-12) reckons only basic prices and does not include taxes, rebate/trade discounts, transport and other charges
The item basket comprises of 697 items. The prices are collected from the concerned Ministries/Departments and through survey from the selected Manufacturing units. Weights are based on the value of production adjusted for net imports
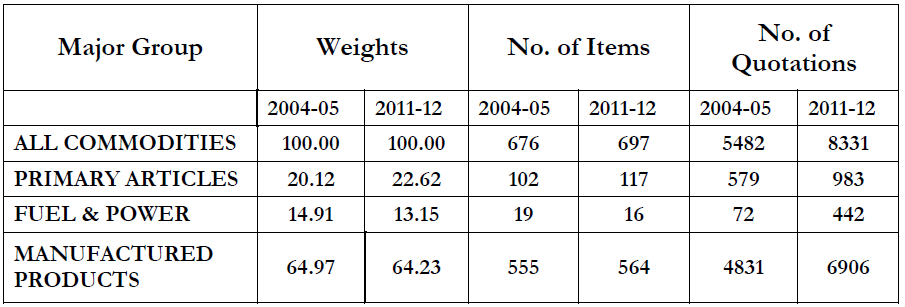
The 697 commodities are divided under three major groups: Primary Articles (117 items) have Weight of 22.62%, Fuel & Power (16 items) have Weight of 13.15% and Manufactured Products (564 items) have Weight of 64.23%
Primary Articles include Food, Non-Food, Minerals, and Crude Petroleum & Natural Gas
Fuel & Power include Coal, Mineral Oils and Electricity
Manufactured Products include:
- Manufacture of food products
- Manufacture of beverages
- Manufacture of tobacco products
- Manufacture of textiles
- Manufacture of wearing apparel
- Manufacture of leather and related products
- Manufacture of wood and of products of wood and cork
- Manufacture of paper and paper products
- Printing and reproduction of recorded media
- Manufacture of chemicals and chemical products
- Manufacture of pharmaceuticals, medicinal chemical and botanical products
- Manufacture of rubber and plastics products
- Manufacture of other non-metallic mineral products
- Manufacture of basic metals
- Manufacture of fabricated metal products, except machinery and equipment
- Manufacture of computer, electronic and optical products
- Manufacture of electrical equipment
- Manufacture of machinery and equipment
- Manufacture of motor vehicles, trailers and semi-trailers
- Manufacture of other transport equipment
- Manufacture of furniture
- Other manufacturing
Also published is WPI Food Index (Weight 24.38%): The Food Index consisting of 'Food Articles' from Primary Articles group and 'Food Product' from Manufactured Products group
For 2024-25, WPI for All Commodities was 154.9, WPI for Primary Articles was 192.5, WPI for Fuel and Power was 150.0 and WPI for Manufactured Products was 142.6
Within Primary Articles, WPI for Primary Articles-Food was 205.3 and WPI Primary Articles- Non Food was 161.7.
| Year | WPI All Commodities | WPI Primary Articles | WPI Primary Articles Food | WPI Primary Articles Non Food | WPI Fuel and Power | WPI Manufactured Products |
|---|---|---|---|---|---|---|
| 2024-25 | 154.9 | 192.5 | 205.3 | 161.7 | 150.0 | 142.6 |
| 2023-24 | 151.4 | 183.0 | 191.3 | 162.4 | 152.0 | 140.2 |
| 2022-23 | 152.5 | 176.8 | 179.5 | 172.1 | 159.5 | 142.6 |
| 2021-22 | 139.4 | 160.7 | 167.3 | 158.1 | 124.6 | 135.0 |
| 2020-21 | 123.4 | 145.7 | 160.7 | 130.5 | 94.0 | 121.5 |
| 2019-20 | 121.8 | 143.3 | 155.8 | 128.7 | 102.2 | 118.3 |
| 2018-19 | 119.8 | 134.2 | 143.7 | 123.1 | 104.1 | 117.9 |
| 2017-18 | 114.9 | 130.6 | 143.2 | 119.6 | 93.3 | 113.8 |
| 2016-17 | 111.6 | 128.9 | 140.3 | 122.2 | 86.3 | 110.7 |
| 2015-16 | 109.7 | 124.6 | 134.9 | 118.2 | 86.5 | 109.2 |
| 2014-15 | 113.9 | 125.1 | 131.5 | 115.1 | 107.7 | 111.2 |
| 2013-14 | 112.5 | 122.4 | 124.5 | 118.4 | 114.7 | 108.5 |
| 2012-13 | 106.9 | 111.4 | 110.9 | 113.3 | 107.1 | 105.3 |
| 2011-12 | 100.0 | 100.0 | 100.0 | 100.0 | 100.0 | 100.0 |
The Government periodically reviews and revises the base year of the macroeconomic indicators as a regular exercise to capture structural changes in the economy and improve the quality, coverage and representativeness of the indices. In this direction, the base year of All-India WPI was revised from 2004-05 to 2011-12 by the Office of Economic Advisor (OEA), Department of Industrial Policy and Promotion, Ministry of Commerce and Industry to align it with the base year of other macroeconomic indicators like the Gross Domestic Product (GDP) and Index of Industrial Production (IIP)
Prior to 2011-12, the Wholesale Price Index (WPI) series in India had undergone six revisions in 1952-53, 1961-62, 1970-71, 1981-82, 1993-94 and 2004-05
By definition, all indices have values of 100 for 2011-12, since it is the Base Year in the latest series
In the new series of WPI, prices used for compilation do not include indirect taxes in order to remove impact of fiscal policy. This is in consonance with international practices and will make the new WPI conceptually closer to 'Producer Price Index'
For quick reference, we capture major changes in weights, number of items and quotations between WPI 2004-05 and WPI 2011-12
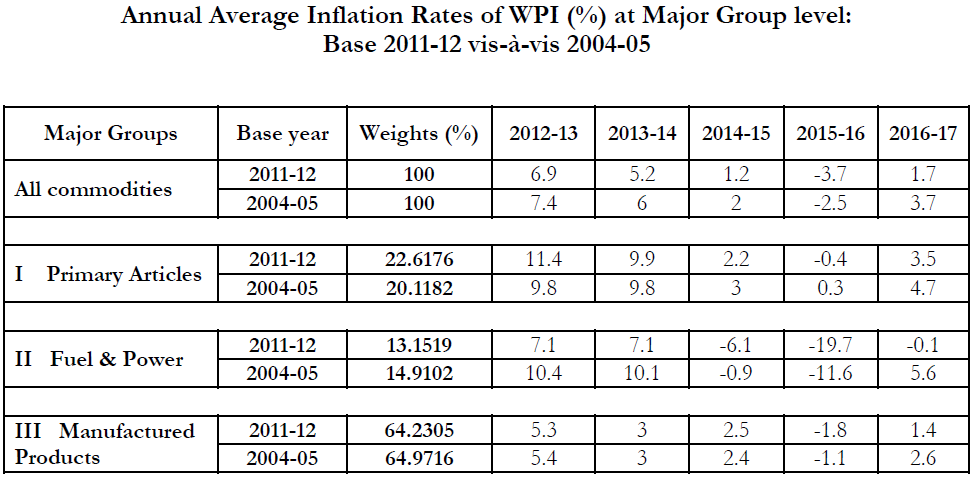
We also capture Annual Average Inflation Rates of WPI (%) at Major Group level: Base 2011-12 vs 2004-05, as per Press Release Dated 12th May 2017: Revision of base year of All-India Wholesale Price Index (WPI) from 2004-05 to 2011-12
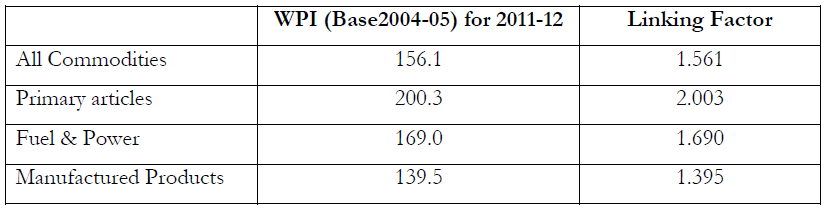
Linking Factor:
The press releases highlights:
In view of the conceptual and methodological difference between the 2004-05 and 2011-12 series, the estimate of linking factor will vary depending on the type of method used. Therefore, users are free to choose any method as may be considered appropriate by them. However, as in the past, in order to maintain continuity in the time series data on wholesale price index, the linking factor using the arithmetic conversion method for All Commodities and the three major groups of WPI are given in the Table below