IIP Use Based Monthly
Our section IIP: Use Based Classification Annual captured how the reframing into six Use Based Categories has been done in the new series, comprising (i) Primary goods (ii) Capital goods (iii) Infrastructure / construction goods (iv) Intermediate goods (v) Consumer durables (vi) Consumer non-durables, and captured annual trend in these Use Based Indices
The weightages of the six categories are: Primary goods 34.05 %, Capital goods 8.22 %, Intermediate goods 17.22 %, Infrastructure/ Construction goods 12.34 %, Consumer Durables 12.84 % and Consumer Non-durables 15.33 %
This section captures monthly indices of these use based categories
| Month | Primary goods | Capital goods | Intermediate goods | Infrastructure construction goods | Consumer durables | Consumer non durables |
|---|---|---|---|---|---|---|
| Mar-26 | 173.3 | 156.2 | 181.4 | 229.0 | 146.2 | 150.6 |
| Feb-26 | 155.0 | 129.7 | 170.5 | 213.0 | 135.4 | 146.0 |
| Jan-26 | 167.9 | 124.2 | 183.3 | 229.5 | 139.4 | 161.3 |
| Dec-25 | 164.6 | 124.2 | 183.3 | 220.4 | 139.2 | 181.1 |
| Nov-25 | 151.0 | 117.5 | 170.2 | 200.3 | 135.1 | 170.8 |
| Oct-25 | 148.9 | 111.5 | 169.2 | 197.3 | 128.1 | 138.8 |
| Sep-25 | 143.2 | 122.8 | 171.0 | 197.7 | 146.2 | 145.2 |
| Aug-25 | 149.2 | 112.2 | 170.7 | 200.4 | 134.3 | 132.7 |
| Jul-25 | 149.0 | 121.7 | 174.6 | 204.3 | 135.8 | 147.9 |
| Jun-25 | 152.1 | 114.6 | 167.8 | 197.3 | 130.7 | 143.9 |
| May-25 | 158.6 | 119.3 | 170.0 | 198.8 | 129.0 | 152.5 |
| Apr-25 | 151.9 | 108.3 | 165.5 | 192.9 | 126.9 | 146.9 |
| Mar-25 | 169.5 | 136.3 | 175.6 | 214.6 | 138.8 | 149.0 |
| Feb-25 | 152.3 | 115.4 | 159.1 | 191.7 | 126.4 | 146.7 |
| Jan-25 | 162.8 | 119.3 | 172.5 | 200.2 | 130.0 | 165.1 |
| Dec-24 | 157.7 | 114.7 | 170.1 | 195.4 | 123.8 | 166.9 |
| Nov-24 | 147.7 | 106.7 | 158.5 | 177.3 | 121.5 | 158.1 |
| Oct-24 | 149.8 | 109.2 | 165.0 | 184.2 | 129.8 | 146.4 |
| Sep-24 | 141.3 | 116.5 | 160.8 | 178.8 | 132.9 | 145.7 |
| Aug-24 | 141.6 | 107.4 | 162.3 | 181.5 | 129.8 | 141.8 |
| Jul-24 | 150.1 | 114.0 | 164.6 | 179.7 | 126.6 | 147.1 |
| Jun-24 | 156.0 | 111.3 | 159.1 | 184.9 | 127.1 | 145.2 |
| May-24 | 160.9 | 105.3 | 162.4 | 186.3 | 130.2 | 154.0 |
| Apr-24 | 152.2 | 95.0 | 157.8 | 184.2 | 119.5 | 150.9 |
| Mar-24 | 163.1 | 131.6 | 169.2 | 195.2 | 129.9 | 155.2 |
| Feb-24 | 148.2 | 106.7 | 157.6 | 179.5 | 121.9 | 149.9 |
| Jan-24 | 154.3 | 108.3 | 163.8 | 186.6 | 121.4 | 164.9 |
| Dec-23 | 151.9 | 103.8 | 159.8 | 180.3 | 114.5 | 179.7 |
| Nov-23 | 143.8 | 98.0 | 151.3 | 164.2 | 106.5 | 157.2 |
| Oct-23 | 146.1 | 106.1 | 157.5 | 175.9 | 123.0 | 142.4 |
| Sep-23 | 138.8 | 112.6 | 154.2 | 172.8 | 125.0 | 142.6 |
| Aug-23 | 145.4 | 107.4 | 157.4 | 176.8 | 123.2 | 148.3 |
| Jul-23 | 141.8 | 102.1 | 153.8 | 170.3 | 117.0 | 153.5 |
| Jun-23 | 146.7 | 107.4 | 154.2 | 170.9 | 116.8 | 146.7 |
| May-23 | 149.9 | 102.6 | 156.9 | 173.2 | 115.6 | 149.8 |
| Apr-23 | 142.2 | 92.4 | 152.0 | 169.8 | 108.1 | 154.7 |
| Mar-23 | 158.3 | 123.0 | 159.4 | 181.7 | 118.6 | 147.5 |
| Feb-23 | 139.9 | 104.9 | 145.1 | 165.7 | 108.3 | 154.8 |
| Jan-23 | 149.9 | 104.9 | 155.6 | 176.9 | 108.8 | 164.4 |
| Dec-22 | 145.0 | 100.1 | 154.1 | 170.9 | 108.8 | 174.4 |
| Nov-22 | 132.6 | 99.1 | 146.3 | 161.7 | 111.9 | 162.7 |
| Oct-22 | 131.2 | 87.2 | 143.8 | 156.2 | 106.1 | 130.3 |
| Sep-22 | 128.5 | 103.9 | 145.3 | 156.9 | 123.8 | 138.9 |
| Aug-22 | 129.4 | 95.0 | 146.6 | 152.8 | 116.2 | 134.9 |
| Jul-22 | 131.7 | 97.1 | 149.0 | 151.3 | 121.4 | 141.7 |
| Jun-22 | 139.3 | 104.4 | 146.6 | 150.8 | 125.3 | 145.9 |
| May-22 | 144.7 | 94.9 | 151.7 | 153.3 | 113.9 | 137.5 |
| Apr-22 | 139.5 | 88.5 | 149.5 | 149.7 | 110.7 | 138.9 |
| Mar-22 | 153.2 | 111.8 | 156.6 | 169.5 | 128.9 | 150.3 |
| Feb-22 | 130.8 | 94.5 | 143.7 | 152.0 | 112.9 | 137.6 |
| Jan-22 | 136.5 | 94.9 | 153.5 | 158.9 | 118.5 | 154.4 |
| Dec-21 | 133.7 | 92.9 | 151.8 | 154.0 | 122.5 | 161.6 |
| Nov-21 | 126.5 | 82.1 | 141.3 | 141.5 | 106.6 | 147.9 |
| Oct-21 | 128.5 | 89.8 | 147.2 | 153.6 | 129.5 | 149.7 |
| Sep-21 | 117.3 | 93.3 | 142.9 | 145.0 | 131.0 | 147.3 |
| Aug-21 | 127.2 | 91.1 | 144.7 | 148.3 | 121.6 | 148.3 |
| Jul-21 | 128.5 | 92.4 | 143.7 | 144.4 | 118.7 | 145.9 |
| Jun-21 | 122.4 | 81.2 | 132.7 | 137.9 | 100.1 | 141.8 |
| May-21 | 122.8 | 61.9 | 129.1 | 129.5 | 71.6 | 135.6 |
| Apr-21 | 126.5 | 79.0 | 139.6 | 144.0 | 103.3 | 140.0 |
| Mar-21 | 145.0 | 109.2 | 153.9 | 158.9 | 133.0 | 157.2 |
| Feb-21 | 125.0 | 93.3 | 138.0 | 139.9 | 125.0 | 147.6 |
| Jan-21 | 134.4 | 93.2 | 149.7 | 150.1 | 123.9 | 149.8 |
| Dec-20 | 130.1 | 95.8 | 150.3 | 151.0 | 124.9 | 161.1 |
| Nov-20 | 122.2 | 84.3 | 138.4 | 137.3 | 113.0 | 149.1 |
| Oct-20 | 117.9 | 91.3 | 140.7 | 144.1 | 133.8 | 148.7 |
| Sep-20 | 112.1 | 90.3 | 133.6 | 132.7 | 129.0 | 147.4 |
| Aug-20 | 108.8 | 75.9 | 129.4 | 130.7 | 109.5 | 140.0 |
| Jul-20 | 114.3 | 70.9 | 125.4 | 128.6 | 99.4 | 149.3 |
| Jun-20 | 109.3 | 63.8 | 108.2 | 114.9 | 78.2 | 147.5 |
| May-20 | 106.0 | 35.4 | 83.7 | 88.4 | 39.7 | 135.3 |
| Apr-20 | 92.4 | 7.0 | 44.6 | 20.3 | 5.5 | 72.7 |
| Mar-20 | 134.4 | 72.6 | 125.7 | 117.6 | 83.2 | 121.7 |
| Feb-20 | 131.0 | 97.4 | 145.8 | 145.0 | 117.3 | 153.4 |
| Jan-20 | 133.4 | 102.4 | 146.8 | 146.7 | 124.0 | 158.3 |
| Dec-19 | 129.6 | 93.7 | 146.9 | 146.4 | 117.3 | 158.1 |
| Nov-19 | 124.5 | 91.1 | 140.9 | 134.5 | 116.7 | 150.2 |
| Oct-19 | 121.7 | 88.5 | 136.4 | 129.9 | 113.3 | 138.6 |
| Sep-19 | 113.8 | 91.4 | 134.1 | 127.6 | 122.5 | 144.0 |
| Aug-19 | 121.9 | 88.7 | 135.9 | 130.7 | 122.0 | 144.4 |
| Jul-19 | 128.1 | 91.8 | 140.4 | 140.1 | 130.3 | 146.6 |
| Jun-19 | 127.8 | 101.9 | 136.5 | 140.6 | 120.0 | 138.0 |
| May-19 | 131.9 | 103.9 | 138.8 | 145.0 | 133.8 | 149.8 |
| Apr-19 | 125.8 | 96.2 | 123.7 | 135.0 | 127.1 | 140.0 |
| Mar-19 | 140.0 | 118.6 | 154.4 | 155.4 | 131.7 | 156.6 |
| Feb-19 | 121.1 | 107.7 | 118.5 | 141.1 | 125.1 | 153.9 |
| Jan-19 | 131.0 | 107.1 | 127.0 | 147.2 | 128.7 | 159.2 |
| Dec-18 | 126.6 | 114.7 | 129.9 | 146.1 | 124.2 | 163.4 |
| Nov-18 | 124.8 | 100.0 | 120.2 | 135.5 | 118.3 | 148.6 |
| Oct-18 | 129.5 | 114.1 | 125.5 | 143.9 | 139.7 | 143.4 |
| Sep-18 | 120.0 | 115.0 | 125.6 | 137.2 | 136.9 | 145.6 |
| Aug-18 | 120.7 | 112.2 | 126.6 | 138.6 | 135.1 | 140.0 |
| Jul-18 | 123.6 | 98.7 | 121.4 | 136.1 | 133.5 | 135.1 |
| Jun-18 | 127.1 | 109.5 | 121.8 | 142.4 | 133.6 | 128.5 |
| May-18 | 129.0 | 106.1 | 123.4 | 140.8 | 133.5 | 138.6 |
| Apr-18 | 119.7 | 97.6 | 120.1 | 135.9 | 124.4 | 132.8 |
| Mar-18 | 136.5 | 130.5 | 137.4 | 147.9 | 136.1 | 154.5 |
| Feb-18 | 119.5 | 118.8 | 124.8 | 138.5 | 124.0 | 146.6 |
| Jan-18 | 129.2 | 111.1 | 130.6 | 138.3 | 125.6 | 153.3 |
| Dec-17 | 128.0 | 110.1 | 131.0 | 134.0 | 119.3 | 153.4 |
| Nov-17 | 120.9 | 104.3 | 125.4 | 129.3 | 122.0 | 149.1 |
| Oct-17 | 122.1 | 97.6 | 122.6 | 132.0 | 119.0 | 132.1 |
| Sep-17 | 117.0 | 107.6 | 123.8 | 125.3 | 129.9 | 136.9 |
| Aug-17 | 117.8 | 101.7 | 123.0 | 128.3 | 128.1 | 131.4 |
| Jul-17 | 115.7 | 96.5 | 119.8 | 124.6 | 117.0 | 128.3 |
| Jun-17 | 116.4 | 99.8 | 120.0 | 130.2 | 117.6 | 128.2 |
| May-17 | 122.0 | 99.7 | 123.3 | 130.8 | 125.1 | 140.9 |
| Apr-17 | 116.5 | 88.9 | 119.6 | 125.2 | 119.7 | 123.5 |
| Mar-17 | 132.5 | 134.7 | 134.1 | 135.6 | 128.2 | 135.4 |
| Feb-17 | 115.2 | 101.9 | 120.7 | 122.6 | 115.4 | 136.5 |
| Jan-17 | 122.0 | 98.8 | 123.9 | 128.7 | 116.7 | 138.5 |
| Dec-16 | 123.3 | 97.3 | 121.9 | 125.8 | 116.8 | 131.3 |
| Nov-16 | 117.0 | 98.7 | 117.7 | 113.7 | 118.3 | 120.5 |
| Oct-16 | 119.2 | 94.3 | 122.3 | 124.8 | 130.7 | 122.1 |
| Sep-16 | 109.8 | 99.0 | 121.2 | 124.7 | 135.4 | 123.9 |
| Aug-16 | 110.0 | 94.8 | 123.6 | 124.9 | 122.8 | 122.6 |
| Jul-16 | 113.2 | 97.6 | 123.2 | 119.5 | 119.9 | 123.3 |
| Jun-16 | 116.7 | 106.3 | 121.5 | 128.9 | 121.9 | 122.3 |
| May-16 | 117.6 | 101.3 | 122.5 | 130.9 | 124.3 | 128.4 |
| Apr-16 | 113.1 | 93.4 | 115.4 | 119.6 | 120.6 | 113.5 |
| Mar-16 | 125.2 | 123.1 | 130.1 | 134.1 | 129.0 | 125.9 |
| Feb-16 | 114.3 | 104.4 | 118.0 | 125.0 | 121.0 | 123.6 |
| Jan-16 | 117.5 | 99.4 | 120.0 | 125.4 | 119.1 | 126.4 |
| Dec-15 | 114.8 | 103.7 | 119.4 | 119.2 | 123.0 | 131.6 |
| Nov-15 | 110.9 | 93.7 | 111.4 | 109.4 | 110.8 | 116.7 |
| Oct-15 | 113.3 | 98.9 | 116.8 | 116.2 | 128.8 | 115.6 |
| Sep-15 | 107.4 | 107.0 | 119.0 | 114.7 | 122.8 | 109.9 |
| Aug-15 | 111.1 | 94.3 | 118.2 | 117.3 | 114.4 | 110.2 |
| Jul-15 | 108.6 | 89.7 | 120.2 | 120.6 | 119.7 | 107.7 |
| Jun-15 | 107.9 | 92.6 | 114.6 | 120.9 | 116.6 | 109.8 |
| May-15 | 112.4 | 88.3 | 117.4 | 121.9 | 113.1 | 115.4 |
| Apr-15 | 100.4 | 85.5 | 115.7 | 118.6 | 110.3 | 113.3 |
| Mar-15 | 114.1 | 121.9 | 123.5 | 120.5 | 126.2 | 130.7 |
| Feb-15 | 103.4 | 100.1 | 112.1 | 112.5 | 113.4 | 121.9 |
| Jan-15 | 112.4 | 88.3 | 117.1 | 122.7 | 115.5 | 122.1 |
| Dec-14 | 111.8 | 99.0 | 117.2 | 119.3 | 116.9 | 124.9 |
| Nov-14 | 106.8 | 88.1 | 114.4 | 115.5 | 116.0 | 110.8 |
| Oct-14 | 107.0 | 82.2 | 111.2 | 115.0 | 109.4 | 100.3 |
| Sep-14 | 101.7 | 104.5 | 117.5 | 112.9 | 126.4 | 108.2 |
| Aug-14 | 103.5 | 91.7 | 117.6 | 112.2 | 112.4 | 108.6 |
| Jul-14 | 103.1 | 94.4 | 118.2 | 119.1 | 115.3 | 115.3 |
| Jun-14 | 105.6 | 100.8 | 116.8 | 117.9 | 108.3 | 109.9 |
| May-14 | 107.3 | 92.8 | 116.8 | 121.8 | 114.4 | 110.8 |
| Apr-14 | 103.5 | 82.4 | 117.1 | 114.0 | 108.4 | 107.2 |
| Mar-14 | 114.4 | 117.8 | 121.8 | 119.8 | 120.7 | 121.5 |
| Feb-14 | 101.3 | 98.7 | 108.5 | 114.2 | 110.8 | 111.2 |
| Jan-14 | 109.7 | 93.2 | 113.1 | 120.5 | 115.9 | 118.0 |
| Dec-13 | 109.3 | 97.0 | 113.4 | 111.2 | 109.8 | 119.5 |
| Nov-13 | 99.8 | 92.6 | 105.0 | 104.8 | 105.9 | 102.4 |
| Oct-13 | 100.1 | 94.1 | 108.2 | 105.4 | 124.5 | 106.4 |
| Sep-13 | 100.0 | 96.7 | 110.9 | 108.1 | 116.5 | 106.2 |
| Aug-13 | 100.2 | 94.9 | 111.4 | 108.5 | 105.1 | 106.9 |
| Jul-13 | 100.3 | 93.0 | 111.0 | 110.0 | 107.0 | 107.9 |
| Jun-13 | 97.2 | 91.9 | 105.2 | 104.0 | 104.6 | 105.8 |
| May-13 | 103.7 | 99.6 | 106.2 | 116.0 | 102.9 | 108.8 |
| Apr-13 | 98.0 | 89.8 | 104.2 | 114.3 | 106.1 | 105.1 |
| Mar-13 | 109.7 | 130.1 | 114.8 | 117.8 | 111.9 | 120.3 |
| Feb-13 | 95.4 | 100.2 | 103.1 | 104.1 | 103.3 | 109.7 |
| Jan-13 | 105.9 | 93.8 | 107.7 | 110.0 | 108.2 | 113.2 |
| Dec-12 | 104.6 | 101.5 | 108.1 | 107.6 | 103.6 | 117.5 |
| Nov-12 | 98.3 | 90.9 | 100.1 | 99.4 | 94.2 | 102.6 |
| Oct-12 | 102.5 | 95.5 | 104.7 | 101.0 | 115.1 | 102.4 |
| Sep-12 | 92.4 | 102.8 | 104.6 | 98.8 | 107.2 | 98.2 |
| Aug-12 | 96.5 | 101.9 | 103.0 | 97.2 | 101.1 | 103.8 |
| Jul-12 | 98.9 | 97.0 | 102.7 | 106.0 | 102.2 | 103.7 |
| Jun-12 | 99.7 | 101.9 | 103.5 | 102.2 | 104.9 | 104.9 |
| May-12 | 104.0 | 98.7 | 105.6 | 117.4 | 105.1 | 99.8 |
| Apr-12 | 98.2 | 89.5 | 103.6 | 103.1 | 102.0 | 97.0 |
We would like to highlight that IIP (Basic or Use-Based) is a production volume based index and not a price based
However, in the new series, data for 109 item groups (weight: 19.22%) is collected in value terms. Many of these item groups have production span of generally more than one month for which data is reported on ‘work in progress’. This helps to avoid sudden jumps if the data were collected in quantity terms. The value data reported for such items need to be deflated using an appropriate price deflator.
In absence of a Producers’ Price Index in India, the Working Group recommended using Wholesale Price Index (WPI) for deflating value based items in the new series of IIP. Accordingly WPI with base 2011-12 has been used to deflate the value based items in order to compute indices and growth rates
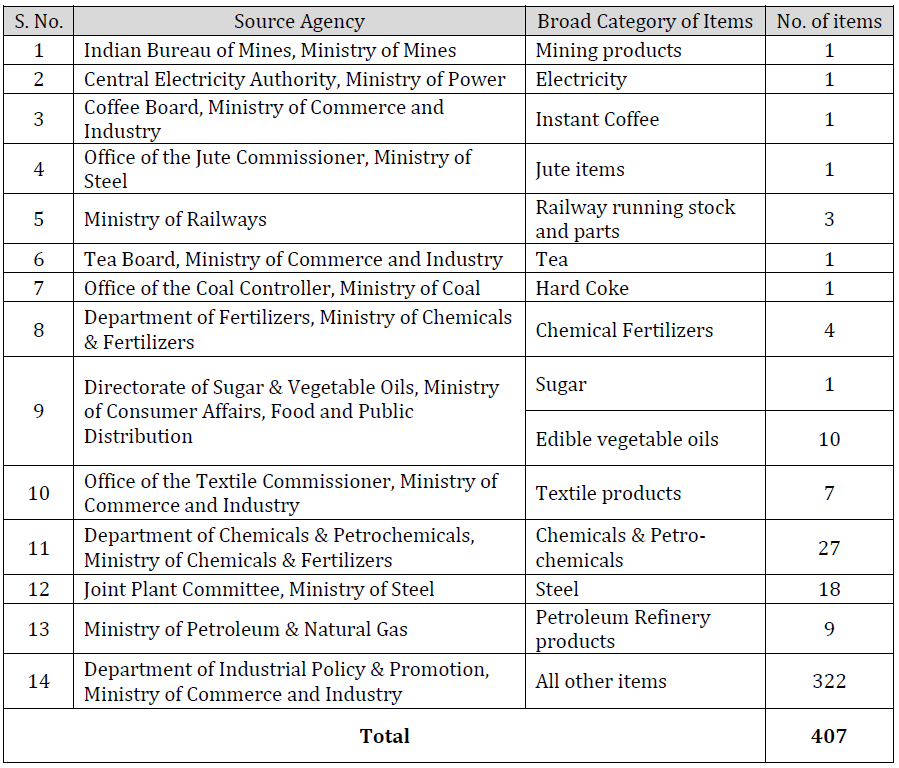
Data for compilation of IIP in new series is sourced from 14 source agencies in various Ministries/Departments. Each of the source agencies based on their administrative domain, collect the production data of the concerned list of item groups, and provide the same to Economic Statistics Division, CSO after due validation. The details of source agencies and broad subject of data collection is as given in Table below: